The spot price of gold is rising to a 20-week high today in early commodity trading action as inflation worries continue to support higher demand for the precious metal while the markets await the release of the PCE Price Index – another inflation gauge – this Friday.
Gold is on track to post its best monthly performance since July 2020, with the price advancing as much as 7.85% during May while the yellow metal has closed with gains in 15 of the past 18 gold trading sessions.
So far today, spot gold is up 0.5% at $1,908 per troy ounce, this being the first time that the commodity is surging above the $1,900 level since 8 January this year.
Increasing concerns about inflation possibly spinning out of control in the United States and sustained weakness in the US dollar are the primary catalysts behind this latest uptick in the price of the precious metal.
So far this month, the value of the US dollar – as tracked by Bloomberg’s Dollar Index (DXY) – is reporting a 1.1% decline against a basket of foreign currencies following a 3% drop in the greenback recorded in April.
This Friday, the US Bureau of Economic Analysis is expected to publish its closely followed PCE Price Index, an alternative indicator to the traditional consumer price index (CPI) that measures the variation in the price of goods and services in the United States.
According to Koyfin, economists are expecting to see a 2.9% annualized variation in the Core PCE – a metric that excludes the effect of food and energy costs – while the month-on-month variation is forecasted to land at 0.6%.
Moreover, the Commission Futures Trading Commission (CFTC) will be releasing its weekly report covering net speculative positions in gold futures and traders will probably be keeping an eye on a positive change in the total number of net long positions – which stood at 198,900 contracts by the end of last week.
Data from ETF Database shows that the top gold exchange-traded funds (ETF) by assets – the SPDR Gold Trust (GLD) and the iShares Gold Trust (IAU) – have reported net positive inflows of $1.48 billion and $133 million in the past 30 days, marking a turning point in the situation for gold ETFs as they had been experiencing a strong wave of outflows since October last year.
Meanwhile, some analysts have been supportive of the long-standing thesis that gold could provide investors with a hedge against inflation.
In a recent note to clients, Societe Generale’s analysts commented: “History shows that over time the price of gold closely tracks real bond yields”. Meanwhile, they also emphasized that gold could “partially offset capital losses on bonds” in a scenario of higher inflation that leads to a sustained downtick in bond yields (yields move inversely to bond prices).
The outlook for gold appears to be bullish based on the current macro setup, as the Federal Reserve continues to be reluctant in considering the possibility of tapering its asset purchases or shifting its current ultra-accommodative policy.
What’s next for gold?

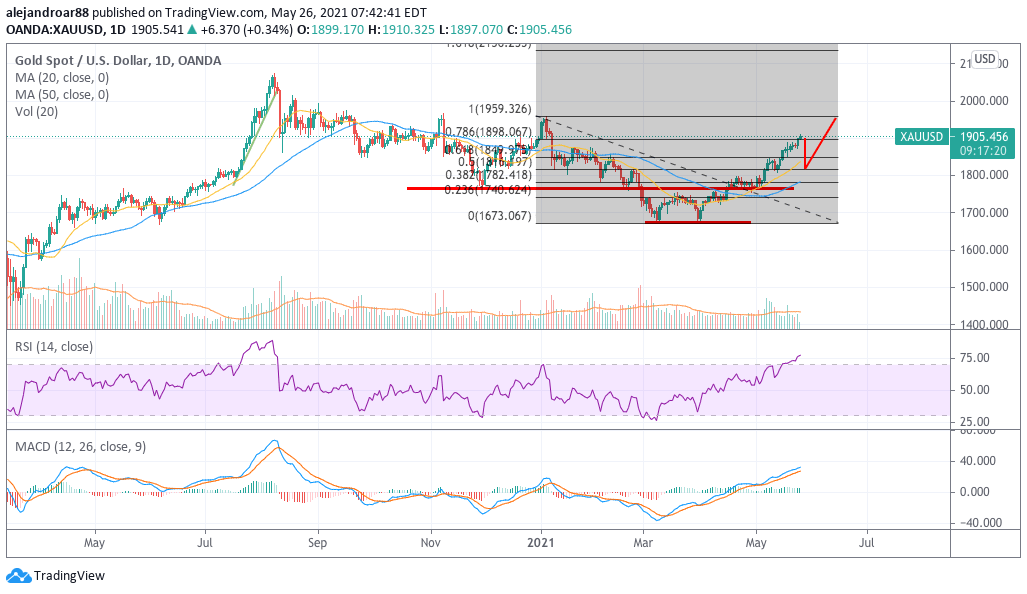
The latest uptrend for gold emerged back on 31 March when the spot price of the precious metal formed a double-bottom at $1,675 per ounce. Back in early April, we reported that a break above the $1,820 level would provide strong confirmation that the commodity could advance to its January highs and that is exactly what has been happening as positive momentum has accelerated.
However, both the RSI and the MACD have already moved to overbought territory as the rally is starting to overheat. In this context, it would be plausible to see gold prices retreat a bit, possibly back to the $1,820 level before the uptrend resumes.
If that support area holds once the downtick occurs, chances are that this could be just the beginning of a new bullish cycle for the precious metal, with a first target set at $1,960 per troy ounce.
Trusted & Regulated Stock & CFD Brokers
What we like
- 0% Fees on Stocks
- 5000+ Stocks, ETFs and other Markets
- Accepts Paypal Deposits
Min Deposit
$200
Charge per Trade
Zero Commission on real stocks
64 traders signed up today
Visit Now67% of retail investor accounts lose money when trading CFDs with this provider. You should consider whether you can afford to take the high risk of losing your money.
Available Assets
- Total Number of Stocks & Shares5000+
- US Stocks
- German Stocks
- UK Stocks
- European
- ETF Stocks
- IPO
- Funds
- Bonds
- Options
- Futures
- CFDs
- Crypto
Charge per Trade
- FTSE 100 Zero Commission
- NASDAQ Zero Commission
- DAX Zero Commission
- Facebook Zero Commission
- Alphabet Zero Commission
- Tesla Zero Commission
- Apple Zero Commission
- Microsoft Zero Commission
Deposit Method
- Wire Transfer
- Credit Cards
- Bank Account
- Paypall
- Skrill
- Neteller
What we like
- Sign up today and get $5 free
- Fractals Available
- Paypal Available
Min Deposit
$0
Charge per Trade
$1 to $9 PCM
Visit Now
Investing in financial markets carries risk, you have the potential to lose your total investment.
Available Assets
- Total Number of Shares999
- US Stocks
- German Stocks
- UK Stocks
- European Stocks
- EFTs
- IPOs
- Funds
- Bonds
- Options
- Futures
- CFDs
- Crypto
Charge per Trade
- FTSE 100 $1 - $9 per month
- NASDAQ $1 - $9 per month
- DAX $1 - $9 per month
- Facebook $1 - $9 per month
- Alphabet $1 - $9 per month
- Telsa $1 - $9 per month
- Apple $1 - $9 per month
- Microsoft $1 - $9 per month
Deposit Method
- Wire Transfer
- Credit Cards
- Bank Account


