US stock futures are trading higher this morning during the European futures trading session after seeing five consecutive days of losses amid concerns of renewed lockdowns in Europe and a rising number of daily virus cases in the US.
E-mini futures of the S&P 500, Nasdaq 100, and Dow Jones Industrial Average are all trading 0.7% higher at 3,447, 11726, and 28,292 respectively, as investors hope that an agreement on further economic stimulus might be reached today.
Futures are performing positively this morning following yesterday’s sharp turn, as major stocks indexes opened the session in the green zone but quickly turned negative, ending the session at their lowest intraday levels.
Moreover, yesterday was the fifth consecutive day of losses for US stock futures, as a negative backdrop continues to cast a veil of pessimism among investors, especially regarding a persisting virus outbreak around the world.
Other factors contributing to the latest spike in market volatility include a rising number of daily contagions in the US, with infections surging to almost 72,000 cases per day on 16 October according to data from Worldometers – the highest tally since July 31.
Meanwhile, markets remain choppy ahead of the most important political event in the US – the Presidential Election – with a contested election being one of the most feared scenarios by market players due to the surge in volatility that could come alongside that situation.
Finally, European countries have reintroduced restrictions amid a second wave of the virus in the continent, with key nations like France, Germany, and the UK establishing localized lockdowns, curfews, and limitations in the number of people that can gather privately, among other measures to contain the spread of the virus.
This negative backdrop continues to weigh on major stock indexes around the world, while the ongoing earnings season in the US continues to provide important information to market players about the extent of the recovery based on the performance of individual names.
In this regard, according to FactSet, companies within the S&P 500 index are expected to post a 21% year-on-year decline in earnings during the third quarter of this year although analysts will probably focus on the effect of a prolonged virus situation in futures earnings – which reduces the impact of positive or surprising performance during this quarter.
Where are US stock futures headed?
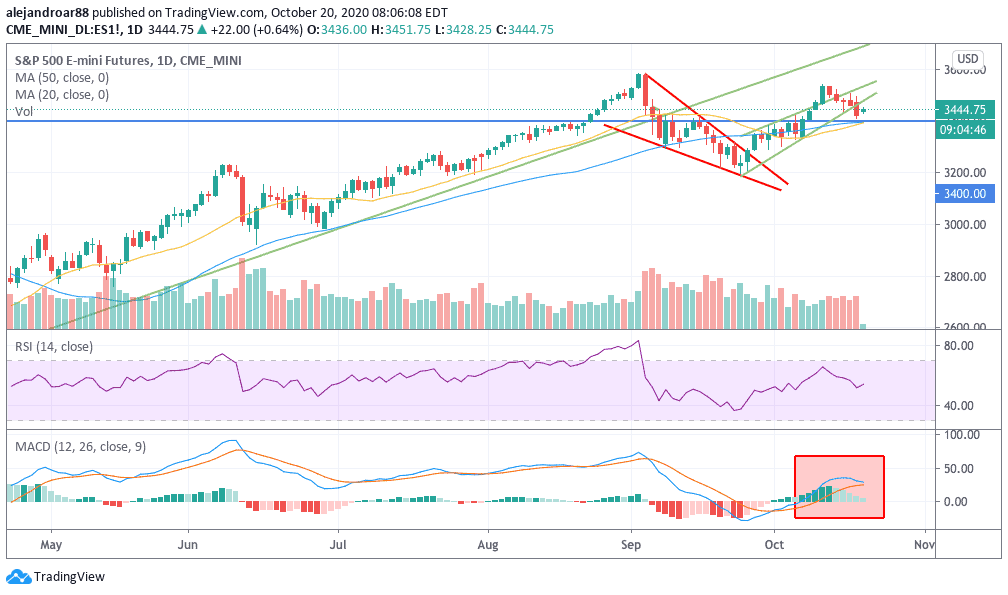
The daily chart above shows that E-mini futures of the S&P 500 have broken below an uptrend that emerged off the late-September lows, following a bearish rising wedge formation that I warned about in a recent article.
At this point, both the 20-day and 50-day moving averages should provide support to the index in the coming sessions if further downward moves are to come. Traders should keep a close eye on the MACD oscillator, as the indicator is closing in on the signal line.
A move below that line, accompanied by negative momentum, could be taken as a short-term sell signal. That said, there are still some potentially bullish formations in play that could end up pushing the index higher.
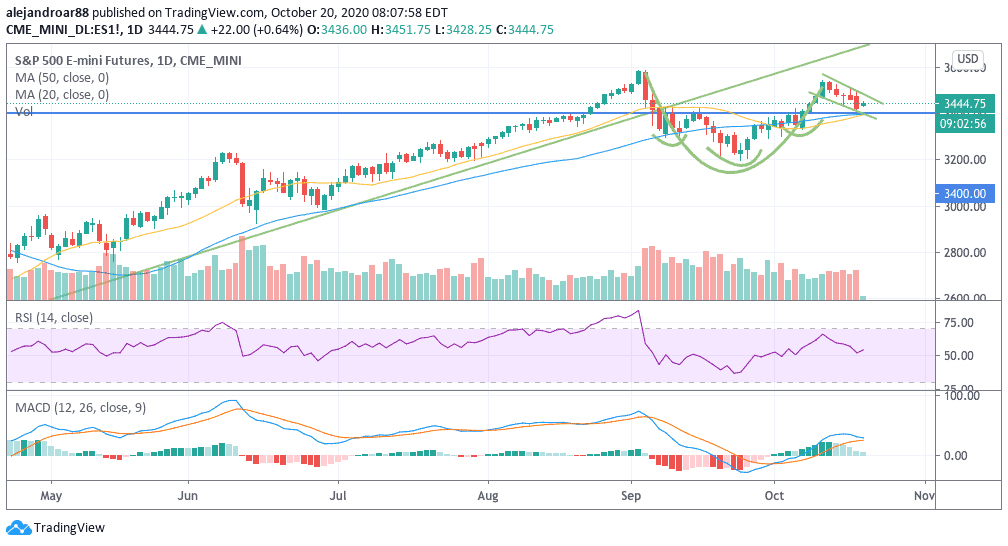
In this regard, the latest price action has also created a cup-and-handle pattern and a potential inverse head & shoulders, both of which are bullish patterns.
It is not uncommon to see multiple, or even conflicting, patterns formed alongside each other. In those cases, the pattern alone does not constitute a signal, as it must be accompanied by other indicators.
Right now, given the drop we have been seeing in momentum levels – as indicated by the MACD oscillator – the probability inclines for a bearish short-term outlook in which the rising wedge shown above could be the pattern to follow to predict the next moves.
In that context, the pattern is already in motion and a further plunge in the index should be expected if positive momentum continues to fade.
It is important to note that a similar setup can also be identified in the Nasdaq 100 index.
Trusted & Regulated Stock & CFD Brokers

What we like
- 0% Fees on Stocks
- 5000+ Stocks, ETFs and other Markets
- Accepts Paypal Deposits
Min Deposit
$200
Charge per Trade
Zero Commission on real stocks
64 traders signed up today
Visit Now67% of retail investor accounts lose money when trading CFDs with this provider. You should consider whether you can afford to take the high risk of losing your money.
Available Assets
- Total Number of Stocks & Shares5000+
- US Stocks
- German Stocks
- UK Stocks
- European
- ETF Stocks
- IPO
- Funds
- Bonds
- Options
- Futures
- CFDs
- Crypto
Charge per Trade
- FTSE 100 Zero Commission
- NASDAQ Zero Commission
- DAX Zero Commission
- Facebook Zero Commission
- Alphabet Zero Commission
- Tesla Zero Commission
- Apple Zero Commission
- Microsoft Zero Commission
Deposit Method
- Wire Transfer
- Credit Cards
- Bank Account
- Paypall
- Skrill
- Neteller
What we like
- Sign up today and get $5 free
- Fractals Available
- Paypal Available
Min Deposit
$0
Charge per Trade
$1 to $9 PCM
Visit Now
Investing in financial markets carries risk, you have the potential to lose your total investment.
Available Assets
- Total Number of Shares999
- US Stocks
- German Stocks
- UK Stocks
- European Stocks
- EFTs
- IPOs
- Funds
- Bonds
- Options
- Futures
- CFDs
- Crypto
Charge per Trade
- FTSE 100 $1 - $9 per month
- NASDAQ $1 - $9 per month
- DAX $1 - $9 per month
- Facebook $1 - $9 per month
- Alphabet $1 - $9 per month
- Telsa $1 - $9 per month
- Apple $1 - $9 per month
- Microsoft $1 - $9 per month
Deposit Method
- Wire Transfer
- Credit Cards
- Bank Account

Alejandro Arrieche
