The demand for new mortgages and refinancing fell last week in the US even as interest rates continue to make record lows since pent-up demand appears to be easing.
According to a weekly report issued by the Mortgage Bankers Association (MBA) mortgage applications went down 4.8% compared to the week before while refinancing applications slid 7% – although they continue to be 52% higher than a year ago.
The reduction in application volumes comes despite the fact that interest rates are at their lowest levels in at least 30 years, according to the survey, with the average rate for 30-year fixed mortgages at 3.05%, down 0.05% from last week.
Applications volumes, however, are still up 22% compared to the same period a year ago, as demand for new homes continues to rebound strongly on the back of extremely low interest rates.
Joel Kan, an economist for the Association, commented: “Even as pent-up demand from earlier in the year wanes, there continues to be action in the higher price tiers, with the average loan balance remaining close to an all-time survey high”.
He added that another reason that could explain the drop would be that lenders are “operating at full capacity” to cope with the significant volume of applications they are receiving and that poses an operational challenge in the current scenario of the pandemic.
How are home builder shares reacting to mortgage applications data?
Homebuilder shares – as tracked by the S&P Homebuilders ETF (XHB) – were dropping 0.76% during yesterday’s stock trading session at $53.22 per share, shedding a few more basis points than broad-market indexes, which also fell during the session.
This sector has been benefitting from the surge in mortgage applications in this low-interest rate environment although the industry is also facing significant challenges to resume its activities at full speed to keep up with the demand.
At the moment, there seems to be an imbalance between the supply and demand for homes in the US, as indicated by home prices – measured by the Case-Shiller U.S. National Home Price Index – which showed a 4.8% annual increase during July and a 4.3% jump compared to the month before.
The degree to which home builders could benefit from this surge in demand could be limited, at least until the pandemic subsides and these companies can get back to work at full capacity.
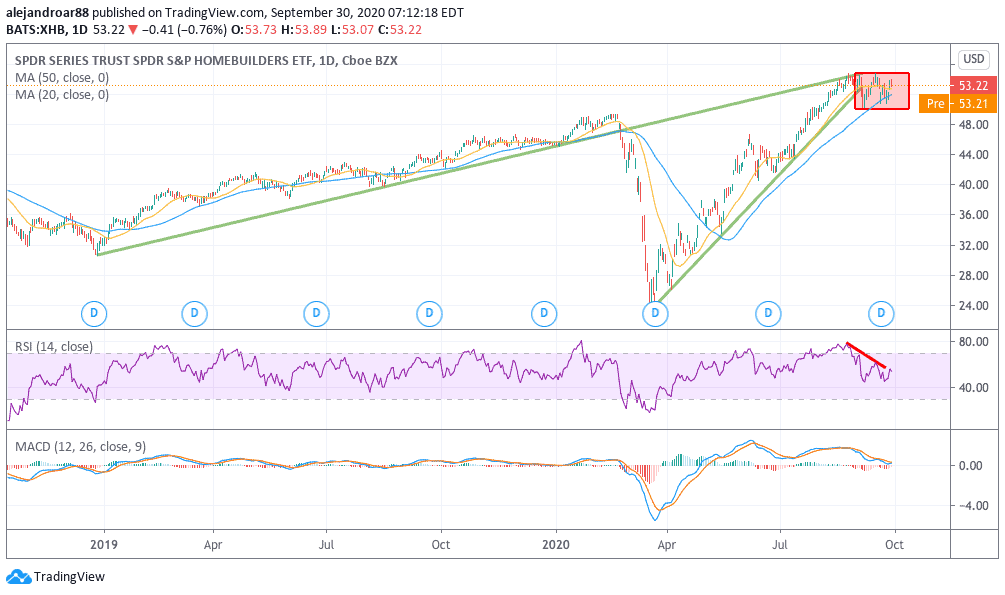
The chart above shows that the homebuilders ETF appears to be struggling to move above the $55 level and, for now, the price action appears to have made a top there – which coincides with the ETF’s pre-pandemic lower trend line.
Market participants seem to be reluctant to let the price move back to that trend line, which would to some extent indicate that the sector has fully recovered its growth trend – a case that is hard to make at the moment.
Meanwhile, the RSI is also showing a bearish divergence, which is an indication that the momentum is weakening around this price level.
Traders should keep an eye on short-term moving averages, which are providing support for the price at the moment as a slide below those levels could result in a short-term correction for the ETF.
Trusted & Regulated Stock & CFD Brokers

What we like
- 0% Fees on Stocks
- 5000+ Stocks, ETFs and other Markets
- Accepts Paypal Deposits
Min Deposit
$200
Charge per Trade
Zero Commission on real stocks
64 traders signed up today
Visit Now67% of retail investor accounts lose money when trading CFDs with this provider. You should consider whether you can afford to take the high risk of losing your money.
Available Assets
- Total Number of Stocks & Shares5000+
- US Stocks
- German Stocks
- UK Stocks
- European
- ETF Stocks
- IPO
- Funds
- Bonds
- Options
- Futures
- CFDs
- Crypto
Charge per Trade
- FTSE 100 Zero Commission
- NASDAQ Zero Commission
- DAX Zero Commission
- Facebook Zero Commission
- Alphabet Zero Commission
- Tesla Zero Commission
- Apple Zero Commission
- Microsoft Zero Commission
Deposit Method
- Wire Transfer
- Credit Cards
- Bank Account
- Paypall
- Skrill
- Neteller
What we like
- Sign up today and get $5 free
- Fractals Available
- Paypal Available
Min Deposit
$0
Charge per Trade
$1 to $9 PCM
Visit Now
Investing in financial markets carries risk, you have the potential to lose your total investment.
Available Assets
- Total Number of Shares999
- US Stocks
- German Stocks
- UK Stocks
- European Stocks
- EFTs
- IPOs
- Funds
- Bonds
- Options
- Futures
- CFDs
- Crypto
Charge per Trade
- FTSE 100 $1 - $9 per month
- NASDAQ $1 - $9 per month
- DAX $1 - $9 per month
- Facebook $1 - $9 per month
- Alphabet $1 - $9 per month
- Telsa $1 - $9 per month
- Apple $1 - $9 per month
- Microsoft $1 - $9 per month
Deposit Method
- Wire Transfer
- Credit Cards
- Bank Account

Alejandro Arrieche
