US stock futures are bouncing today after the sharp downtrend seen last week, with future contracts of the tech-heavy Nasdaq 100 index leading the rally this morning despite an early uptick in US treasury yields.
So far in the day, the Nasdaq is advancing 1.25% at 13,075 after posting losses in 7 of the past 9 sessions. Today’s bounce is following another slight uptick seen on Friday when the index gained 0.62% to close the week with a sharp 4.8% loss.
Meanwhile, E-mini futures of the S&P 500 are up 0.96% as well at 3,846, while those of the Dow Jones Industrial Average (DJIA) are posting a similar 0.9% gain at 31,185 ahead of Wall Street’s opening bell.
A strong uptrend in US Treasury yields last week seems to have been the primary driver for the losses seen by US stocks, as rates for the 10-year issue climbed from 1.369% to as much as 1.515% – almost reaching pre-market-crash levels for the first time since then.
However, yields retreated sharply on Friday to 1.456% while remaining unfazed this morning as Wall Street prepares for the release of important data including the US PMI index released by research firm IHS Markit later today.
“Until some calm and some new peak level of yields is found, this will be the key focus for investors” said Jim Paulsen from The Leuthold Group, in regards to the market’s focus on the yield curve lately.
Meanwhile, the approval of the Johnson & Johnson vaccine – a single-dose treatment that could further assist the United States and other countries in accelerating their vaccination efforts – could provide a boost to the market this week, as bulls continue to see light at the end of the COVID-19 tunnel.
In this regard, the Center for Disease Control and Prevention (CDC) unanimously signed off on J&J’s recently approved vaccine, with the federal government already preparing to ship millions of doses to keep inoculating the country’s population against the virus.
What’s next for US stock futures?

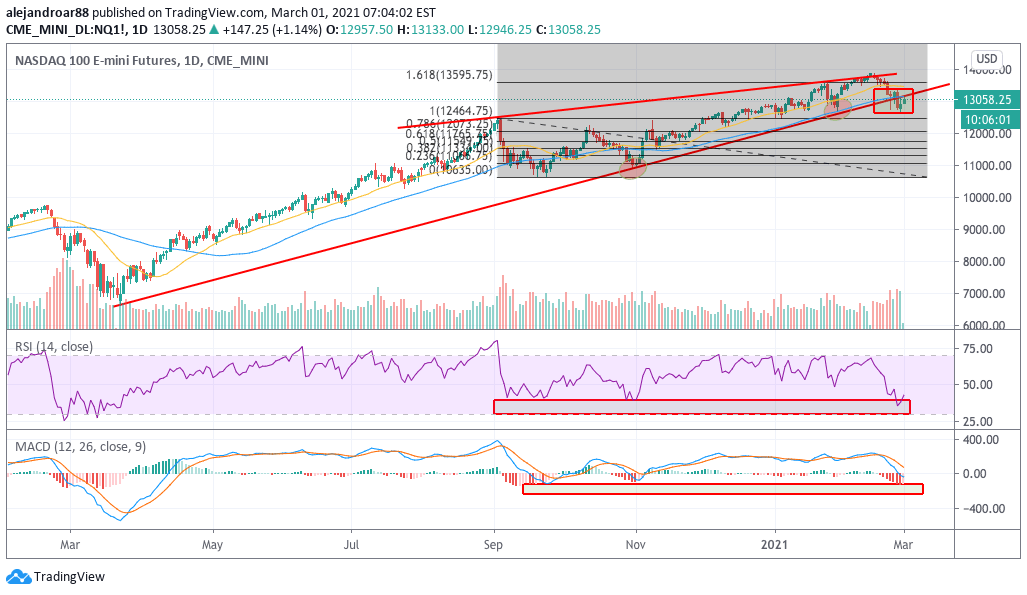
Perhaps the most interesting chart for the week among the three top US stock index futures is that of the Nasdaq 100, as the benchmark is retesting its former lower trend line – which has now become resistance after last week’s strong plunge.
These retests are often decisive in defining the direction that the security will take in the following days or weeks, as a rejection of the move would often result in the continuation of the downtrend while a break above it can indicate that last week’s downturn was just a false break.
With the RSI approaching oversold levels and the MACD currently being in a sharp downtrend, what both indicators are saying is that there was a shift in the momentum for the tech-heavy benchmark and this can lead to a resumption of the downtrend in the coming weeks, possibly as market players keep rotating to less favored areas of the market and out of high-flying tech stocks – i.e. energy and leisure stocks.
If that were to be the case, there could be some further pain ahead for the Nasdaq as the index has not even posted a full-blown 10% correction, only accumulating a 5.7% loss since its 15 February peak.
Trusted & Regulated Stock & CFD Brokers
What we like
- 0% Fees on Stocks
- 5000+ Stocks, ETFs and other Markets
- Accepts Paypal Deposits
Min Deposit
$200
Charge per Trade
Zero Commission on real stocks
64 traders signed up today
Visit Now67% of retail investor accounts lose money when trading CFDs with this provider. You should consider whether you can afford to take the high risk of losing your money.
Available Assets
- Total Number of Stocks & Shares5000+
- US Stocks
- German Stocks
- UK Stocks
- European
- ETF Stocks
- IPO
- Funds
- Bonds
- Options
- Futures
- CFDs
- Crypto
Charge per Trade
- FTSE 100 Zero Commission
- NASDAQ Zero Commission
- DAX Zero Commission
- Facebook Zero Commission
- Alphabet Zero Commission
- Tesla Zero Commission
- Apple Zero Commission
- Microsoft Zero Commission
Deposit Method
- Wire Transfer
- Credit Cards
- Bank Account
- Paypall
- Skrill
- Neteller
What we like
- Sign up today and get $5 free
- Fractals Available
- Paypal Available
Min Deposit
$0
Charge per Trade
$1 to $9 PCM
Visit Now
Investing in financial markets carries risk, you have the potential to lose your total investment.
Available Assets
- Total Number of Shares999
- US Stocks
- German Stocks
- UK Stocks
- European Stocks
- EFTs
- IPOs
- Funds
- Bonds
- Options
- Futures
- CFDs
- Crypto
Charge per Trade
- FTSE 100 $1 - $9 per month
- NASDAQ $1 - $9 per month
- DAX $1 - $9 per month
- Facebook $1 - $9 per month
- Alphabet $1 - $9 per month
- Telsa $1 - $9 per month
- Apple $1 - $9 per month
- Microsoft $1 - $9 per month
Deposit Method
- Wire Transfer
- Credit Cards
- Bank Account


