When people look at the bond market, the primary focus is on the absolute level of yield when assessing its return potential. Today with the low interest rate environment, people fear that the bond market may not offer enough to meet their investment objective while maintaining a disciplined and certain risk profile during this period of extreme market volatility.
One strategy an astute bond investor can employ in order to enhance returns is to take a total return approach which includes capturing both income and price changes. One such way is to employ a Rolling-Down the Yield Curve Strategy.
Essentially, this is a preferred strategy when the yield curve is upward sloping or steep as in the case of today’s market environment. In particular, an investor will purchase a bond at the top of the steepest part of the yield curve and hold that bond long enough until it reaches a lower yielding part of the curve. In this process and assuming that there is enough duration, the bond that you purchased, coupled with collecting the coupon, will see its price appreciate as it ages with the maturity shortening. After this gain, the bond is sold and the proceeds can be redeployed. So the key to this strategy, all else being equal, is simply time and knowing where to focus.
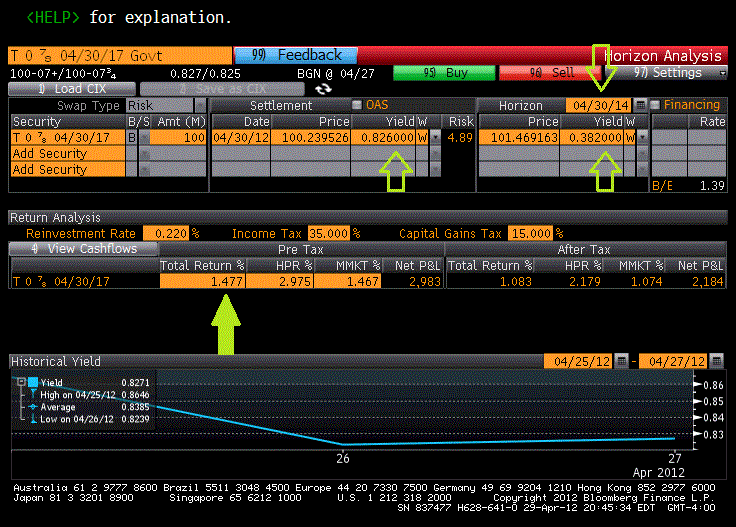
To illustrate the Rolling-Down the Yield Curve strategy, we look at today’s U.S. Treasury Curve. From here we focus on the 5-Year which is yielding 0.826 percent. An investor will purchase that bond at that yield and will hold the bond for a period of time. While held and collecting coupon, the bond’s maturity will shorten. So after two years, that original 5-Year will become a 3-Year bond. Assuming stable interest rates, the yield of that bond will “roll” toward the current 3-Year yield of 0.382 percent. This rolling will in turn, result in price appreciation.
US Treasury Curve
To quantify this, we turn to using horizon analysis for the current 5-Year U.S. Treasury which is shown in the illustration below. As you can see we purchased the bond at a yield of 0.826 percent or a dollar price of 100.2395. For 100,000 face amount, the total proceeds including accrued income equates to $100,240. Assuming that rates are stable during our time horizon of 2-Years or ending April 30, 2014, we plug in today’s 3-Year yield of 0.382 percent. Again we know that in two years our original 5-Year will become a 3-Year and hence assuming stable interest rates, we can use the aforementioned yield. This yield at this horizon date will correspond to a price of 101.4692. This dollar price which we plan to monetize by selling in the open markets equates to total proceeds of $103,222 or a profit of $2,983. Given our reinvestment rate of 0.22 percent for coupon payments earned during that time period, this profit results in a holding period return of 2.98 percent or 1.48 percent annualized gain. Now, when we compare this gain to a static Hold-to-Maturity strategy we can see the effectiveness of Rolling-Down the Yield Curve.
Rolling Down the Yield Curve
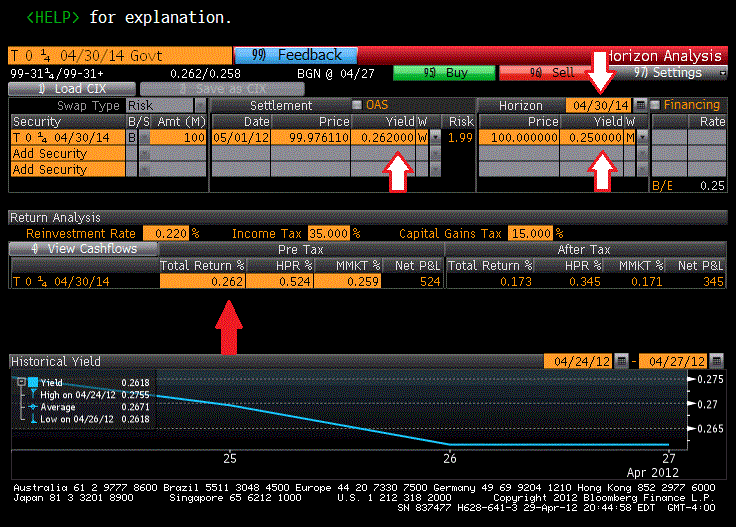
Holding to Maturity
Comparatively, the Rolling-Down the Yield Curve strategy outperforms the Hold-to-Maturity Strategy by $2,459 or by an additional return of 1.22 percent on an annualized basis.
The key to this enhanced strategy is to focus on the part of the maturity spectrum that maximizes the change in yields per the change in maturity assuming there is ample duration. These are the key ingredients to affecting price changes which enhances the income earned from the coupon. Hence, the absolute level of yield as in the case of the Hold-to-Maturity strategy is less of the focus.
So, Rolling-Down the Yield Curve can be utilized on other parts of the yield curve such as from the 7-Year to the 5-Year which has a yield differential of 52 basis points. Similarly, the 10-Year that rolls to the 7-Year has an even greater differential of 59 basis points. Keep in mind that the farther out the maturity, the greater the sensitivity to changes in yield (aka duration) which in turn, increases the risk of the trade.
As an alternative and away from increasing duration, this strategy can be further enhanced by utilizing Corporate Bonds, in either Investment Grade space or the High Yield sectors, which exhibit higher yields (aka spread) than their U.S. Treasury counterparts. As mentioned before, the respective yield curves of the credit sectors need to be upward sloping or steep in order to employ this strategy. (Bondsquawk will cover more in-depth analysis of the corporate bond markets in the coming weeks!)
As with any investment, there are risks. For this particular strategy to produce positive returns, we assume that our yield at the end of our horizon date of two years will be lower than our initial yield at time of entry. In other words, we are betting that yields with maturities that are shorter than our purchased bond (5-Years in our example) will continue to be lower when we exit the trade in two years. So if short term interest rates were to rise within two years, we run the risk of compromising our strategy.
However, given the recent FOMC minutes released last week where Ben Bernanke who continues to battle against high unemployment and headwinds from global debt deleveraging, suggested that U.S. Monetary Policy will continue to be accommodative and short-term interest rates should stay low until late 2014. Furthermore, the recent disappointment in GDP data suggests a slowing economy which in turn, should leave yields on the front end of the curve to remain stable and fairly anchored. As a result, this type of dynamic trading strategy of Rolling-Down the Yield Curve should continue to provide opportunities for enhanced return, despite the low level of interest rates and especially in comparison to the static Hold-to-Maturity strategy.
Trusted & Regulated Stock & CFD Brokers
What we like
- 0% Fees on Stocks
- 5000+ Stocks, ETFs and other Markets
- Accepts Paypal Deposits
Min Deposit
$200
Charge per Trade
Zero Commission on real stocks
64 traders signed up today
Visit Now67% of retail investor accounts lose money when trading CFDs with this provider. You should consider whether you can afford to take the high risk of losing your money.
Available Assets
- Total Number of Stocks & Shares5000+
- US Stocks
- German Stocks
- UK Stocks
- European
- ETF Stocks
- IPO
- Funds
- Bonds
- Options
- Futures
- CFDs
- Crypto
Charge per Trade
- FTSE 100 Zero Commission
- NASDAQ Zero Commission
- DAX Zero Commission
- Facebook Zero Commission
- Alphabet Zero Commission
- Tesla Zero Commission
- Apple Zero Commission
- Microsoft Zero Commission
Deposit Method
- Wire Transfer
- Credit Cards
- Bank Account
- Paypall
- Skrill
- Neteller
What we like
- Sign up today and get $5 free
- Fractals Available
- Paypal Available
Min Deposit
$0
Charge per Trade
$1 to $9 PCM
Visit Now
Investing in financial markets carries risk, you have the potential to lose your total investment.
Available Assets
- Total Number of Shares999
- US Stocks
- German Stocks
- UK Stocks
- European Stocks
- EFTs
- IPOs
- Funds
- Bonds
- Options
- Futures
- CFDs
- Crypto
Charge per Trade
- FTSE 100 $1 - $9 per month
- NASDAQ $1 - $9 per month
- DAX $1 - $9 per month
- Facebook $1 - $9 per month
- Alphabet $1 - $9 per month
- Telsa $1 - $9 per month
- Apple $1 - $9 per month
- Microsoft $1 - $9 per month
Deposit Method
- Wire Transfer
- Credit Cards
- Bank Account


