Day Trading: The Art and Craft of Stalking Stocks as Trading Targets
Some investors like to pour over quarterly, annual and multi-year balance sheets and income statements. They pick apart visible pipelines of ongoing projects, major contract wins and losses and quarterly comparative sales and revenue figures. This is what fundamental investors do. But, however important a company’s fundamentals (valuation, growth targets, revenue, market share) are, they typically don’t drive, nor provide immediate insight into day-to-day stock price moves.
So, if you are heavily into day trading to make your living, what trading tools can you rely upon to deliver insight into potential price moves? The answer: Technical indicators!
Target View Finder: Top-Down or Bottom-Up?
Technical analysts use either of two types of analysis to stalk their trading targets. Each day trader has a unique philosophy and approach of how to analyse individual stocks that they are homing in on, within his/her universe of names.
TOP-DOWN: In this approach, day traders first look at economies and sectors to determine which universe to stalk for likely targets. Once they’ve settled on the broader playing field, they start hunting for individual names. This approach is great for trading stocks that have shown shorter-term moves – like within the past 50-days or so, rather than long-term value (3-5 years).
BOTTOM-UP: Unlike Top-down traders, bottom-up day traders stalk individual names. This approach is agnostic about economies or sectors. If they see potential opportunity in a stock, regardless of what business it is in, or which geography it trades in, they’ll add it to their trading list. The objective is to spot promising companies that have hit a temporary bottom, and use technical analysis to spot dips (buy opportunities) and breakouts (sell opportunity).
One (Top-Down) is a short-term day trading approach, while the other (Bottom-Up) is a medium-to-longer term strategy. However, where opportunity exists, combining the two can offer optimal results for day traders.
Two Tools of the Stalking Trade
There are dozens of technical analysis tools, available to day traders, to help them successfully identify and stalk a target, and then enter and exit a position to make money. Two of these techniques include:
MOVING AVERAGES – Spotting Trends: One very effective stalking strategy commonly uses moving averages. A tactic, in this strategy, is to watch crossover patterns. Specifically, day traders watch a short-term moving average of prices (50-day) crossover to a longer-term average (200-day).
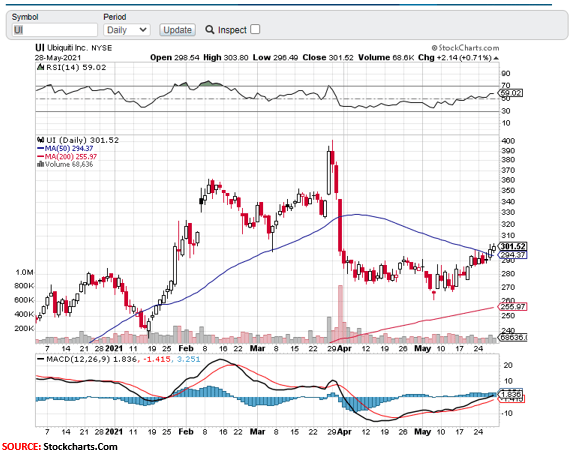
Technically speaking, when the short-term moving average crosses above the longer-term one, it signals to the stalker that an upward price move is underway. That’s a buying opportunity for the day trader. Conversely, if the trend reverses (short-term dips below the long-term), it signals time to bail out (sell) and lock in profits.
MOVING AVERAGE CONVERGENCE/DIVERGENCE (MACD) – Spotting Momentum: It’s always good to stalk a target with a tool, and then confirm a trading opportunity using another (related) tool. The MACD is a trend-following momentum indicator that does just that. At a very macro level, MACD highlights the relationship between a target stock’s 12-day and 26-day moving averages, with a nine-day average used as a “signal line”.
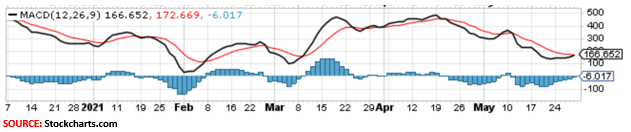
It is typically plotted over a histogram that shows the convergence or divergence (black line) between the two averages. Stalkers may buy the stock if the MACD crosses above the signal line (red line), and either short or sell it when the MACD moves beneath the signal line.
The Trend is Your Friend
Price and volume trend and momentum analysis are vital stalking tools in the arsenal of a day trader. How you use that information depends on your trading style. For instance, if you analyze a stock whose price continues to rise, with higher volume, and find that traders continue to buy unusually high amounts of the stock – it could signal an equity that’s overbought. What goes up, eventually comes down. As a day trader, you’ll want to keep an eye on the stock (if you own it) for an opportune time to sell.
Traders can also use the Relative Strength Index (RSI) – a related momentum indicator – to stalk stocks for signs of being overbought or oversold. They do this by charting the ratio of higher closings over time. This tells the trader which direction the stock’s price is headed. Overbought stocks are typically ripe for a pullback, particularly after they’ve had a parabolic run.
The volume of momentum can confirm whether your trading thesis is accurate, or if you’ve got it wrong. When there’s large volume behind a price rise, it validates the fact that other traders and investors (perhaps even institutional money managers) are as like minded as you. Large-scale redemptions (selling) typically signal a stock that’s out of favour, and therefore primed for a pullback. That’s a great time to either sell or short a stock.
Parting Thoughts
Technical analysis is a great day trading tool that can give day traders valuable insight into a stock’s price (and volume) behaviour. The indicators can be used as forecasting tools to enter a position and/or quickly exit it profitably. However, they must be used with caution. For instance, when you see many traders pile into a stock (based on volume traded), purely on technicals it could signal a buy opportunity. However, traders should use a combination of tools to confirm the true nature of what’s going on:
- What do you do about a stock that’s down on light volume? And what’s going on if it’s down on higher volume?
There is also the problem of mixed signaling that day traders must be aware of. One indicator could signal a buy, while another could flash a sell. While technical indicators do a great job most of the time, they can sometimes deliver false positive and/or false negative signals. That’s why the better day trading strategy is to use a combination of top-down and bottom-up approaches, supported by some fundamental analysis too.
Trusted & Regulated Stock & CFD Brokers

What we like
- 0% Fees on Stocks
- 5000+ Stocks, ETFs and other Markets
- Accepts Paypal Deposits
Min Deposit
$200
Charge per Trade
Zero Commission on real stocks
64 traders signed up today
Visit Now67% of retail investor accounts lose money when trading CFDs with this provider. You should consider whether you can afford to take the high risk of losing your money.
Available Assets
- Total Number of Stocks & Shares5000+
- US Stocks
- German Stocks
- UK Stocks
- European
- ETF Stocks
- IPO
- Funds
- Bonds
- Options
- Futures
- CFDs
- Crypto
Charge per Trade
- FTSE 100 Zero Commission
- NASDAQ Zero Commission
- DAX Zero Commission
- Facebook Zero Commission
- Alphabet Zero Commission
- Tesla Zero Commission
- Apple Zero Commission
- Microsoft Zero Commission
Deposit Method
- Wire Transfer
- Credit Cards
- Bank Account
- Paypall
- Skrill
- Neteller
What we like
- Sign up today and get $5 free
- Fractals Available
- Paypal Available
Min Deposit
$0
Charge per Trade
$1 to $9 PCM
Visit Now
Investing in financial markets carries risk, you have the potential to lose your total investment.
Available Assets
- Total Number of Shares999
- US Stocks
- German Stocks
- UK Stocks
- European Stocks
- EFTs
- IPOs
- Funds
- Bonds
- Options
- Futures
- CFDs
- Crypto
Charge per Trade
- FTSE 100 $1 - $9 per month
- NASDAQ $1 - $9 per month
- DAX $1 - $9 per month
- Facebook $1 - $9 per month
- Alphabet $1 - $9 per month
- Telsa $1 - $9 per month
- Apple $1 - $9 per month
- Microsoft $1 - $9 per month
Deposit Method
- Wire Transfer
- Credit Cards
- Bank Account

Alan Draper Lewis
