Here are the definitions of the 4 different ways the yield curve moves, followed by an in depth explanation of how traders can profit from changes in the yield curve.
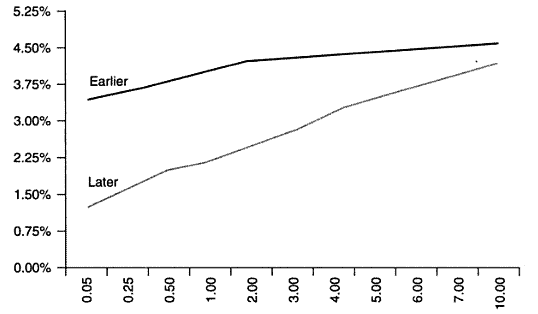
Bull Flattener
When the shape of the yield curve flattens as a result of long term interest rates falling faster than short term interest rates. This can often happen because of a flight to safety trade and/or a lowering of inflation expectations. It is called a bull flattener because this change in the yield curve often precedes the Fed lowering short term interest rates, which is bullish for both the economy and the stock market. (For more on how the Fed changes interest rates go here.)
Here is an example of a bull flattener:

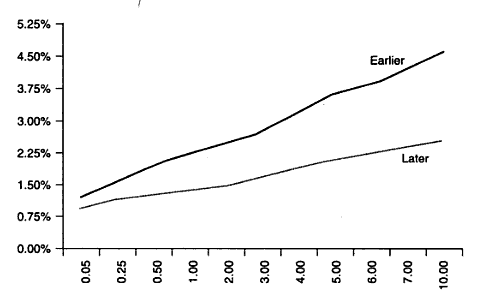
Bear Flattener
When short term interest rates rise faster than long term interest rates. It is called a bear flattener because this change in the yield curve often precedes the Fed raising short term interest rates, which is bearish for both the economy and the stock market.
Here is an example of a bear flattener:
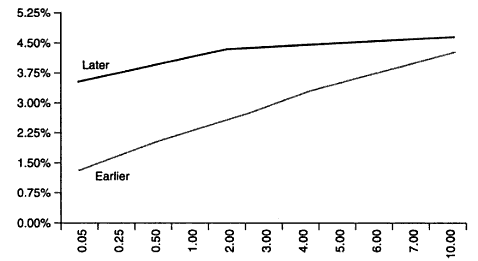
Bull Steepener
When short term interest rates fall faster than long term interest rates. This often happens when the Fed is expected to lower interest rates, a bullish sign for both the economy and stocks.
Here is an example of a Bull Steepener:
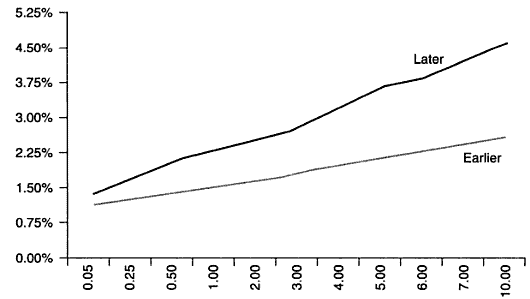
Bear Steepener
When long term interest rates rise faster than short term interest rates. This often happens when inflation expectations pick up, at which point the market may anticipate a fed rate increase to battle upcoming inflation. This scenario would be be bearish for both the economy and stock market.
Here is an example of a bear steepener:
So, how can investors benefit from this information?
This is another example of how an understanding of the bond market, can help stock investors predict and position for future stock market price action. For bond investors specifically, there are also numerous strategies that can be put into place to profit directly from changes in the shape of the yield curve.
Rolling Down the Yield Curve
Rolling down the yield curve is a strategy where investors purchase longer term bonds and then sell them after a certain period of time to profit from the capital appreciation that naturally happens as the bond moves towards maturity. You can read more about this strategy here and here.
The profitability of rolling down the yield curve depends greatly on how the shape of the yield curve changes during the time that you hold the bond. You can read more about how the profitability of rolling down the yield curve will change depending on how the shape of the yield curve changes here.
Trading the Spread Between Long and Short Term Rates
In addition to seeking to profit from overall changes in interest rates, bond investors will also seek to profit from changes in the shape of the yield curve itself.
Flattening Yield Curve
The yield curve flattens as a result of the difference between long term interest rate and short term interest rates shrinking. As discussed above this can happen either from longer term interest rates falling faster than shorter term interest rates (bull flattener) or as a result of short term interest rates rising faster than longer term interest rates (bear flattener). When traders expect the yield curve to flatten, they will go short short-term bonds and long long-term bonds. As the difference between short and long term interest rates converge, the trader should earn more from the short-term bonds they sold short, than they lose on the long-term bonds they went long.
Steepening Yield Curve
The yield curve steepens as a result of the difference between long term interest rates and short term interest rates widening. As discussed above this can happen either from longer term interest rates rising faster than shorter term interest rates (bear steepener) or from short term interest rates falling faster than long term interest rates (bull steepener). When traders expect the yield curve to steepen they will go long short-term bonds and short long-term bonds. As the difference between short and long term interest rates widens, the trader should earn more on the short-term bonds they bought than he loses on the long-term bonds they sold short.
Generally treasury bond futures are used in both these strategies because it is easier to go short and you have access to greater leverage in the treasury futures market. The most popular contracts used for these trades are the 2 or 5 year treasury on the short end of the yield curve and 10 year treasury futures on the long end. If you are interested in reading more about this strategy go here.
Trusted & Regulated Stock & CFD Brokers
What we like
- 0% Fees on Stocks
- 5000+ Stocks, ETFs and other Markets
- Accepts Paypal Deposits
Min Deposit
$200
Charge per Trade
Zero Commission on real stocks
64 traders signed up today
Visit Now67% of retail investor accounts lose money when trading CFDs with this provider. You should consider whether you can afford to take the high risk of losing your money.
Available Assets
- Total Number of Stocks & Shares5000+
- US Stocks
- German Stocks
- UK Stocks
- European
- ETF Stocks
- IPO
- Funds
- Bonds
- Options
- Futures
- CFDs
- Crypto
Charge per Trade
- FTSE 100 Zero Commission
- NASDAQ Zero Commission
- DAX Zero Commission
- Facebook Zero Commission
- Alphabet Zero Commission
- Tesla Zero Commission
- Apple Zero Commission
- Microsoft Zero Commission
Deposit Method
- Wire Transfer
- Credit Cards
- Bank Account
- Paypall
- Skrill
- Neteller
What we like
- Sign up today and get $5 free
- Fractals Available
- Paypal Available
Min Deposit
$0
Charge per Trade
$1 to $9 PCM
Visit Now
Investing in financial markets carries risk, you have the potential to lose your total investment.
Available Assets
- Total Number of Shares999
- US Stocks
- German Stocks
- UK Stocks
- European Stocks
- EFTs
- IPOs
- Funds
- Bonds
- Options
- Futures
- CFDs
- Crypto
Charge per Trade
- FTSE 100 $1 - $9 per month
- NASDAQ $1 - $9 per month
- DAX $1 - $9 per month
- Facebook $1 - $9 per month
- Alphabet $1 - $9 per month
- Telsa $1 - $9 per month
- Apple $1 - $9 per month
- Microsoft $1 - $9 per month
Deposit Method
- Wire Transfer
- Credit Cards
- Bank Account


