There are many different measures of inflation, however most people that are looking for inflation charts are focused on the consumer price index for all urban consumers or CPI-U for short. If you would like to learn more about inflation and the CPI-U go here.
Yearly Inflation Chart 1947-2012
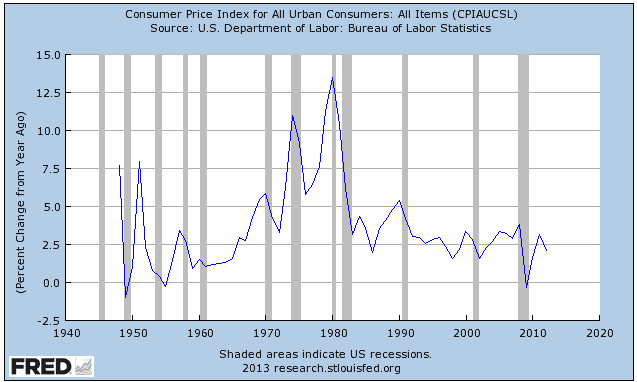
You can find the data for this chart here.
Monthly Inflation Chart 1947 – December 2012
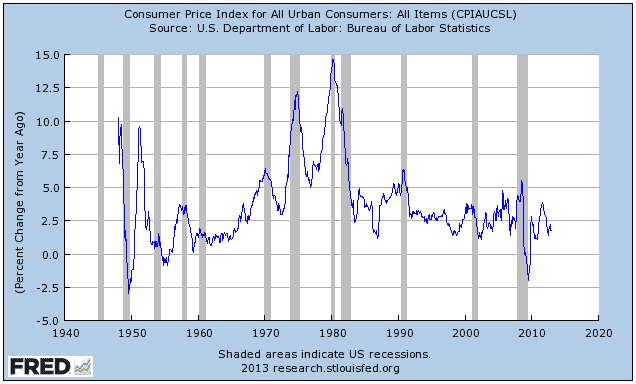
You can find the data in this chart here.
Consumer Price Index Chart
Most people use the percentage change in the CPI when referring to inflation. You will often here something such as “inflation was 3% this year.” The 3% they are talking about is the percentage change in the consumer price index as represented in the inflation charts above. You can however also graph the index itself which you can find the chart for below:
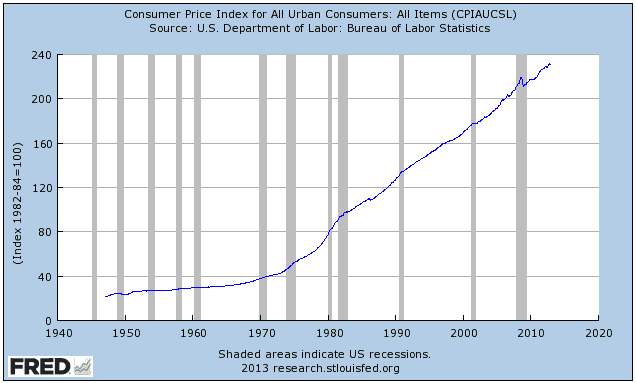
You can find the data for this chart here.
Didn’t find what you were looking for? Let us know in the comments section below and we will do our best to add it.
Trusted & Regulated Stock & CFD Brokers
What we like
- 0% Fees on Stocks
- 5000+ Stocks, ETFs and other Markets
- Accepts Paypal Deposits
Min Deposit
$200
Charge per Trade
Zero Commission on real stocks
64 traders signed up today
Visit Now67% of retail investor accounts lose money when trading CFDs with this provider. You should consider whether you can afford to take the high risk of losing your money.
Available Assets
- Total Number of Stocks & Shares5000+
- US Stocks
- German Stocks
- UK Stocks
- European
- ETF Stocks
- IPO
- Funds
- Bonds
- Options
- Futures
- CFDs
- Crypto
Charge per Trade
- FTSE 100 Zero Commission
- NASDAQ Zero Commission
- DAX Zero Commission
- Facebook Zero Commission
- Alphabet Zero Commission
- Tesla Zero Commission
- Apple Zero Commission
- Microsoft Zero Commission
Deposit Method
- Wire Transfer
- Credit Cards
- Bank Account
- Paypall
- Skrill
- Neteller
What we like
- Sign up today and get $5 free
- Fractals Available
- Paypal Available
Min Deposit
$0
Charge per Trade
$1 to $9 PCM
Visit Now
Investing in financial markets carries risk, you have the potential to lose your total investment.
Available Assets
- Total Number of Shares999
- US Stocks
- German Stocks
- UK Stocks
- European Stocks
- EFTs
- IPOs
- Funds
- Bonds
- Options
- Futures
- CFDs
- Crypto
Charge per Trade
- FTSE 100 $1 - $9 per month
- NASDAQ $1 - $9 per month
- DAX $1 - $9 per month
- Facebook $1 - $9 per month
- Alphabet $1 - $9 per month
- Telsa $1 - $9 per month
- Apple $1 - $9 per month
- Microsoft $1 - $9 per month
Deposit Method
- Wire Transfer
- Credit Cards
- Bank Account