How to Buy Stocks – A Beginners Guide
Trading stocks is not a decision that one should take lightly. For some people, trading stocks is a profession, meaning you’ll have to acquire the trading skills and knowledge to match them up and be successful. But the same as any musician or a handyman must have the right equipment in order to function effectively, a trader must find the right broker, trading platform, and the trading tools that could maximize the chances of generating consistent profits right from the start.
But how do you choose the best trading platform, the most reliable broker, and above all, the most effective and cost-effective way to trade stocks. In this guide, we show you the easiest way to trade stocks, review the top platform in the market, and include essential tips to help you get started with how to buy stocks for beginners.
-
-
How to Trade Stocks in 3 Quick Steps
Trading stocks is the most recognized form of trading, particularly day trading. As a matter of fact, the Amsterdam Stock Exchange is said to have been the first exchange in the world which dates back to 1602 when the first tradable paper was issued by the famous Dutch East India Corporation. Since then, stock trading has become one of the most popular and lucrative options to make money and with the rise of the internet, anyone can get access to trading stocks.
However, together with the evolution of financial markets, new financial tools have been introduced to the market. Nowadays, many traders have one goal; to speculate on the price of a stock, without the need of owning it. For that reason, a new tool called a contract for difference (CFDs) simply mimics the price movements of a stock and allows traders to enter an agreement with another participant without having to deliver/exchange the security.
[three-steps id=”198089″]Where to Buy Stocks
Nowadays, there are plenty of ways to buy stocks. Those include your bank’s service provider, investment banking firms, stocks brokerages, and CFD brokers. To help you get started, below you will find the top three CFD stocks brokers of where to buy stocks in the stock market.
1. eToro – Best Social Trading Platform for Stock Trading
eToro is a well established CFD broker that offers investors an extensive range of stocks through its unique social trading platform. Regulated by FCA, CySEC and ASIC, eToro allows you to trade on more than 800 stocks from 17 different top exchanges across the globe. The leverage ratio varies across different jurisdictions. For example, retail clients in Europe are entitled to a leverage ratio of 1:5 while Australian traders can trade with a leverage ratio of 1:20. Keep in mind that professional traders are allowed to trade with higher leverage of up to 1:400.
Apart from offering CFDs, eToro allows its users to buy a non-leveraged position on stocks, which can be held under your name. This makes eToro one of the few online platforms that allow users to trade real stocks and CFDs. eToro also applies a zero-commission policy for stocks on the eToro platform when a trader decides to invest in a non-leveraged buy (long) position.
The eToro platform has millions of users and is quite similar to a social network. The largest social trading platform in the world allows users to interact with each other and share trading ideas. This makes eToro an ideal platform for beginners, although experienced traders are not excluded. eToro maintains a minimum deposit requirement of $200 to open a basic trading account.
An additional advantage of eToro when it comes to stock trading is the new research feature which allows you to get stats about the company in a convenient and simple visualization. But perhaps the main advantage of the platform is the ability to copy trades of other top traders, meaning you don’t have to be a trading expert to trade the markets.
Our Rating
- eToro is the largest social trading network with more than 4.5 million users
- An extensive range of more than 800 stocks
- Highly regulated by FCA, CySEC and ASIC
- eToro charges a withdrawal fee
- Relatively high spreads for stock CFDs
62% of investors lose money when trading CFDs2. Plus500 – CFD Broker to Trade Stocks
If you are looking for a CFD broker that specializes in stocks, Plus500 is well worth considering. The broker offers you to trade shares from all popular markets such as the USA, UK, Germany, and many more with a leverage ratio of up to 1:20 and low spreads in comparison to other brokers in the industry. Plus500 efforts to offer the most popular and relevant stocks the most popular and highly liquid stocks in the market. At the time of writing, some of the stocks offered by Plus500 include Gilead, Tesla, Google, Apple, Netflix, and Berkshire Hathaway.
Plus500 is regulated in multiple jurisdictions that include ASIC in Australia and Asia, Plus500UK Ltd authorized & regulated by the FCA, and CySEC in Europe. Moreover, Plus500 is a public company listed on the London Stock Exchange under the symbol LSE: PLUS.
Our Rating

- Easy to use trading platform
- Low spreads for shares
- A leverage ratio of 1:30 on stocks
- Plus500 is not available in the United States
- Does not support MetaTrader
- Hedging and Scalping is forbidden
- Does not offer educational resources for beginners, or signal and social trading
80.5% of retail CFD accounts lose money.3. Stash Invest – Best Stock CFDs Broker for US Residents
Stash Invest is a trading app, similar to Robinhood, that allows traders in the United States to start trading with small amounts (initial deposit of $5). At the time of writing, Stash Invest has approximately 4.3 million users who can trade a huge selection of stocks and Exchange Traded Funds (ETFs).
The pricing structure of Stash includes a monthly fee of between $1 to $9 depending on the type of account you choose (beginner, growth, and Stash+). Basically, Stash Invest allows you to trade on thousands of stocks and ETFs through a web-based platform or a mobile app. But perhaps the most useful feature of Stash Invest is the ability to buy fractional shares which makes trading much easier.
The bottom line; if you are located in the United State and want to start trading stocks without the hassle of complicated trading platforms and a long registration process, Stash Invest might be the right broker for you.
Our Rating
- Huge selection of stocks and ETFs
- The trading platform is extremely easy to use
- Fractional shares - you can simply buy or sell a percentage of a single share
- Stash Invest charges a monthly fee
- No leveraged trading
How to Buy Stocks Online on eToro’s Trading Platform
If you’re looking to trade stock CFDs, we find eToro to be the most intuitive and easiest option to trade stocks. Below, we have outlined a step-by-step guide to help you make your first trade on eToro’s platform.
Note: As is the case with all regulated stock trading sites, you will first need to open an account and verify your identity. You’ll also need to deposit some funds.Step 1: Search for a Certain Stock
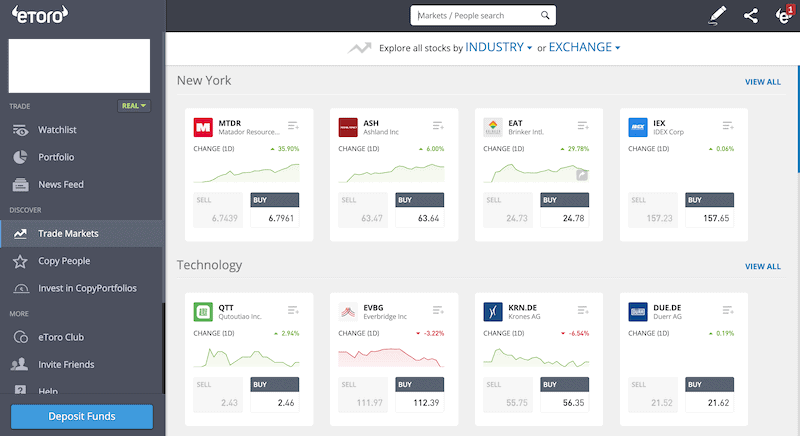
Once you are logged in to eToro’s trading platform, look for the stocks tab where you can find hundreds of different stocks. These are categorized into different exchanges and industries.

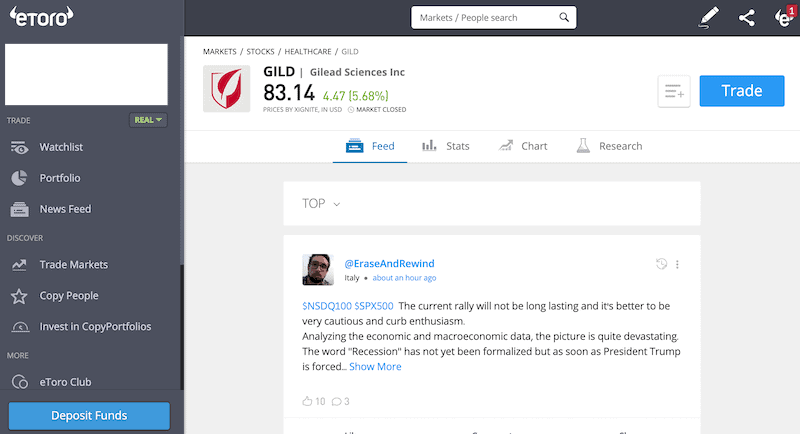
Once you find a stock you wish to buy or sell, simply click on the stock and you will immediately be transferred to the stock page where you can view the Twitter feed, posts from other members, stats, charts, and research.

Alternatively, you can search for a certain stock at the top of the screen where you should see a search box.
Step 2: Trading
Whenever you are ready to insert an order, click on the Trade button and a new window will open.

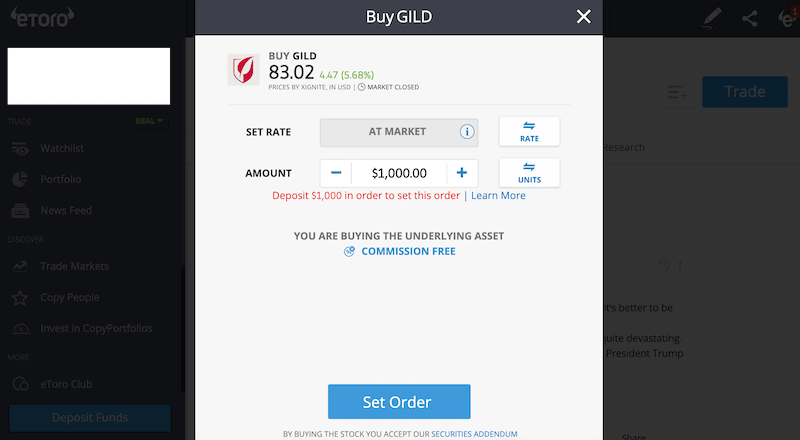
Step 3: Insert an Order
In the order box, you’ll have the set the order terms and click the Set Order button in order to execute the order. Take note that you can simply make a transaction ‘At Market’ which is a market order that allows you to enter a position immediately at the best price the broker offers you. Otherwise, you will be able on the rat and insert a limit order to buy or sell at a fixed price.
Besides the amount of the position and the rate in which you would like to enter into the position, you’ll have the set a stop-loss and take-profit orders.
Stock Trading Strategies
Now that you have selected one of the brokers above and you know how to insert a market order, you must find a trading strategy that suits you. But obviously, it’s easier said than done. Finding the right trading strategy is a trial and error experiment in which you must try different strategies and identify the most beneficial one that suits your personality. Here are some essential tips to help you find a successful trading strategy:
Trading time frames: There are four types of active trading strategies. Those include scalping, day trading, swing trading, and position trading. The difference between these trading strategies is the duration a trader holds a position. Scalping refers to short-term trades of seconds and minutes. Day trading is a trading technique in which a trader closes all positions at the end of the trading day. Swing trading is a style of trading that takes place over a period of between 2-5 days. And position trading is a trading strategy where a trader holds a position for a long period of time.
Best time to buy stocks: Many traders take advantage of volatile trading hours such as market opening, times of economic data and announcements, and times in which European and US stock markets are open simultaneously. Keep in mind that market volatility can be nerve-racking for traders but also can be a good thing.
Start Small and maintain a low leverage ratio: Instead of risking a large amount of capital in order to make one good transaction, you should start small and form a successful trading strategy before you increase your account balance. Furthermore, it’s advisable that you trade with a reasonable leverage ratio of up to 1:20 (available on eToro and Plus500) and focus on a maximum of 1-3 stocks at the beginning.
How Much Money can you Make from Stock Trading?
Technically speaking, you can make a living from day trading and for some people, one good trade can make a monthly, yearly, and even life income. However, trading is a risky business and there is a learning curve that must take place. Moreover, there’s no magic number as to how much you can make from stock trading; t’s all relative to your initial investment, location, the time you can spend, and highly depends on your personality and goals.
You should also keep in mind that there are different types of traders and investors based on their strength, psychology, purpose, and motivation. Some traders are looking to find a consistent trading method that gives them favorable statistical odds, while others are looking for one extremely profitable position they can hold for a long period of time.
But as a general guideline, you should always be using stops and limits orders to enforce a risk/reward ratio. A risk-reward ratio is a simple calculation of how much you are willing to risk per trade. For example, if you have a risk-reward ratio of 1:3, it means you’re willing to risk $1 to potentially make a profit of $3. For long term traders, a good risk-reward ratio tends to be anything above 1:3, while scalping and day traders typically use a risk-reward ratio of 1:1, 1:0.5, and even 1:0.1.
Another notable factor is the difference between an investor and a trader. An investor’s goal can be described best as one that is looking for a steady income with minimum risk or a large return with a higher risk. Trading, on the other hand, is a method of buying and selling stocks for a short period of time with the purpose of taking advantage of relatively small price fluctuations.
What Should You do Before Choosing a Stock?
Eventually, buying a stock is a technical process in which you’ll have to find a trading platform that enables you to insert orders in the market. But there are many factors and ‘must-dos’ to consider before choosing a specific stock.
Keep in mind that it’s quite difficult to determine what kind of trader you are or aspire to be before you start trading. Furthermore, like any other profession, it takes time to learn the right techniques and become a pro. Nevertheless, here are some important steps you should take before you choose a stock:
- Determine your Goals – The first step is to decide what is the purpose of your trading/investment account. If you plan to day trade, you will need to make a daily/weekly stop loss and take profit limits. Some investors, on the other hand, are more focused on generating steady income or increase their capital by smart long-term investments.
- Get Familiar with Trading Terms and Slangs – Trading/investing terminology is something every trader must know, and therefore, you should learn some basic trading terms such as bid, ask spread, hold, limit and market order, stop loss and take profit, short, arbitrage, bull and bear market, blue-chip and penny stocks.
- Find a Relevant News Source – Negative or positive news has an effect on the stock market. Those include macroeconomic data, political events, an announcement of a new product, annual reports, etc. You should find a professional news media that will help get the most reliable and accurate market news and opinions.
- Use a Screener/Watchlist to Track your Preferred Stocks – No one can track a large number of stocks. In the beginning, you should pick a maximum number of 10-15 stocks to follow and add these stocks to a stock screener/watchlist.
- Learn Technical Analysis – Even if you’re not aiming to be a technical analysis expert, you must know how to view a certain stock on a chart and analyze it. We also recommend that you get familiar with basic technical analysis indicators such as Moving Average (MA), Relative Strength Index (RSI), Bolinger Bands, support and resistance levels, and Fibonacci retracements.
How Should you Analyze a Stock?
Once you have found a stock that intrigues you and meets your criteria, it’s time to analyze the stock. There are two types of stock analysis: fundamental and technical analysis.
Fundamental Analysis
Fundamental analysis refers to evaluating the factors that contribute to the supply of demand for certain financial security. The fundamental analysis of a stock is sort of subjective but you must find out relevant news, the business structure of the company, main products, the company’s competitors, and its debt. Some of the most crucial elements when you fundamentally analyze a certain stock include:
- Revenues (quarterly and annually)
- Earnings per share (EPS)
- Price/Earnings (P/E) ratio
- Debt to equity/asset ratios
- Beta
- Relevant news
Technical Analysis
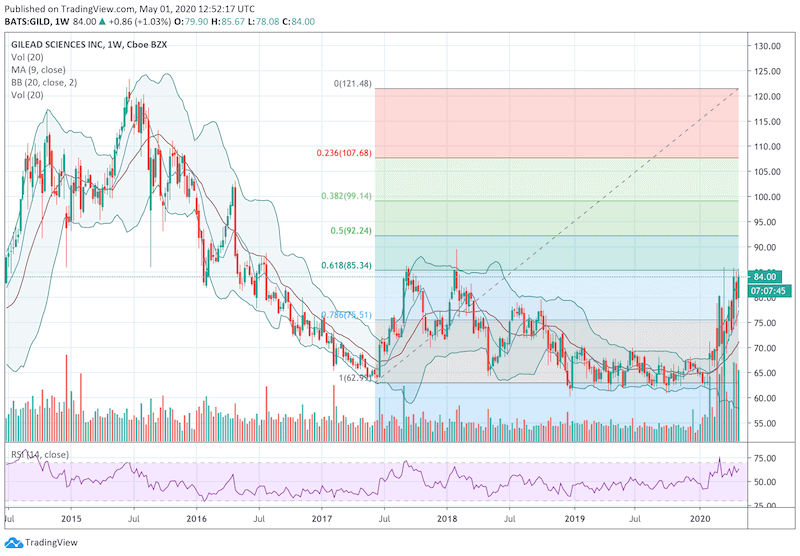
Technical analysis is a tool used to examine and predict the futures price of a security by using historical price movements and statistical parameters. Technical analysis of stock allows you to get a clue about the past performance of the company, its all-time high, support and resistance levels, volume, and volatility. For example, in the chart below we have analyzed Gilead (NASDAQ: GILD), one of the most profitable pharmaceutical companies these days. As you can see in the chart below, we have used some of the most popular trading indicators such as RSI, Moving Average, Bollinger Bands, and Fibonacci retracements.

Gilead (NASDAQ: GILD) Weekly Chart
How to Pick the Best Stocks to Buy?
For people who are looking for day-trading opportunities, stocks with high volume, liquidity, and volatility are better day-trading assets. Therefore, it’s advisable that you trade popular stocks such as Apple, Google, Netflix, Tesla, Gilead, etc. These stocks will allow you to come in and out easily due to tight bid and ask spreads, and the constant price movement. Moreover, popular stocks tend to swing a lot during the day following macroeconomic events, the company’s reports, and important news.
Otherwise, if you are looking for a stock that you can hold for a long period of time, you might want to find trendy or blue-chip stocks. For example, cybersecurity, cannabis, and artificial intelligence stocks are among the most promising fields these days. As of 2020, here are the some of the best sectors to invest for the long-term:
- Solar (renewable) Energy
- Blockchain Technology and Digital Assets
- Autonomous (driverless) Cars
- Water Technology
- Food Engineering Companies
- Cybersecurity
- Artificial Intelligence
- Cannabis
Blue-chip stocks such as General Electric and Berkshire Hathaway typically have dividend yields, solid balance sheets, and stable cash flow.
Trading Stocks – How does the CFDs Market Work?
A contract for difference, also known as CFDs, is a form of a derivative secondary market where traders can speculate on certain security without owning the asset. When you trade CFDs, you basically enter into an agreement with the broker or another participant in the market to exchange the price difference of the underlying asset.
Trading stocks through the CFD market has several advantages over the traditional stock exchange market. Those include the high leverage, low trading costs (no fixed costs), the ability to short a stock without any restrictions, no day-trading requirement, and an easy registration process.
Having said that, you should also keep in mind that CFDs are complex instruments and come with a high risk of losing your capital.
Glossary of Stocks Terms
StockA stock is a representation of a company’s equity. When a company wants to raise capital, it issues stocks to the public. It is the aggregation of the total stocks owned by one individual that inform their shareholding of the company.
SharesA share is an indivisible unit of capital that expresses the ownership relationship between a shareholder and a particular company, mutual fund, REITs or limited partnership. A share indicates a portion of ownership (claim) that one has on a company or fund.
DividendDividend refers to the portion of the company’s profits that is distributed to its stockholders. It can be on a quarterly or annual basis.
Bull marketA bull market is an economic condition where the stock markets are in an extended period of consistent increase in stock prices.
Bear MarketA stock market is said to be bearish if it is involved in extended periods of continuous price decrease of the stock prices.
Stock ExchangeA stock exchange is an institution or a platform where shares and stocks and a host of other money market instruments are traded.
Return On Investment (ROI)The return on investment is the profit you make from trading in or investing in shares and stocks of a particular company. It often comes from selling the investment at a higher price than was originally bought or benefiting from dividends and other profit-sharing schemes as a result of owning and holding onto a particular investment.
BrokerA broker may be a person or entity that engages in the buying and selling of different types of investments on behalf of other individuals or entities at a fee (or commission).
Day TradingDay Trading is the practice of buying a money market investment product and selling it as soon it reports price increase or loss, within the same day. Traders engaged in day trading are referred to as “day traders” or “active traders”
ArbitrageArbitrage is the act of buying and selling security at different stock exchanges or markets with varying prices. If, for instance, stock ABC sells at $11 on one exchange and $11.75 on the other, arbitraging involves buying from at the low price exchange and profiting by selling it at the higher-priced exchange.
IndexA stock index is a statistical measure of the change in the stock and securities market. It comprises a hypothetical portfolio of different companies whose change in prices is calculated to determine market performance.
Initial Public Offering (IPO)The Initial Public Offering refers to the sale of company stock to the public for the first time. It is the act of taking a company public and is highly regulated by such financial regulators like the SEC in the USA and FCA in the UK.
OptionsOptions are derivative financial instruments whose price is based on the value of their underlying tradable security like shares and stocks. They are contracts that give the holder an option to buy or sell the underlying asset at a later date. Unlike futures, an options contract holder has the choice to buy/sell or not.
Call optionsThis is an options contract that gives the holder an option to buy the underlying asset before the expiry date.
Sell optionsThis option gives its holder the choice of selling the underlying asset before its expiry date
Mutual FundsA mutual fund refers to a company that pools funds from different investors and invests these funds in stocks, bonds, and other financial market securities. They then distribute the capital gains from these invests to their members.
Over-the-CounterThe process through which stocks for companies that are not listed with accredited stock exchanges like the NYSE are traded. It is a broker-dealer network for unlisted stocks for companies that do not meet listing requirements set by the organized exchanges.
OverboughtA stock is said to be overbought if it is traded excessively over a short period of time and at unjustifiably high prices.
OversoldA stock is said to be oversold if it is consistently traded below its true value.
Ask PriceAlso referred to as the offer or asking price, this refers to the lowest price that the seller will take for a stock.
Bid PriceBid price refers to the maximum price that a buyer is willing to pay for a stock.
VolumeIn the stock trading context, Volume refers to the number of shares that change hands within a given period of time, be it a day, month or annually. It is trading/investment indicator where rising trade volumes point to a healthy stock while dwindling volumes are indicators of investor pessimism towards a stock.
VolatilityRefers to the statistical measure of the change in price of a stock over a given period of time. It is a measure of the rate and the time it takes for a stock price to move from high to low and how long it remains within a certain price range. The higher the volatility, the higher the risk.
52-Week HighThis refers to the highest closing price recorded by a given stock in the last 52 weeks.
52-Week LowThis refers to the lowest closing price that a particular stock recorded in the last 52 weeks.
Bid-Ask SpreadThe bid-ask spread refers to the difference between the lowest price that a seller is willing to take for their stock and the highest price that a buyer is willing pay for the stock. It is the difference between the quoted ask and bid prices.
Market OrderA market order is an instruction by an investor to the broker or brokerage platform asking them to buy/sell a stock or any other security at the best price available at that moment. It is often issued when an investor wishes to enter or exit the market quickly and at the prevailing rates.
Limit OrderA limit order is an order that triggers a sale or buy when a predetermined or better price is met. For a buy limit order, the buy order is executed once the set limit price or a better price is triggered. The sell limit order on the hand triggers the sale of stocks if the limit price or better price is hit.
Stop OrderAlso referred to as a stop loss order, it is an order that triggers a buy or sell action once a predetermined price level is hit. It is designed to help you minimize possible loss on a given trade should the markets move against your bet.
Take ProfitTake profit is a type of limit order dictating the price level at which the broker or brokerage platform is to close a trade for profit.
Capital GainsCapital gain refers to the value rise of a tradable financial instrument that makes its selling price higher than the buying price. It can also be referred to as the profit realized from liquidating a capital investment like stocks.
ETFsAn ETF is a collection of many tradable instruments like bonds, stocks, and commodities. These are listed on the exchanges and traded like ordinary stocks.
Debt-to-Equity RatioThe debt-to-equity (D/E) ratio is a financial ration tool used to measure the financial health of a company by gauging value of its equity in relation to debt. It is achieved by dividing the company’s total liabilities in relation to its shareholder’s equity.
Dividend InvestingThis is an investment strategy where the investor only buy shares that have consistently paid out high dividends in the past or others with the fastest dividend rates. Dividend investing strategy advocates are more interested in how much a shares pays in dividends than its price fluctuations.
Growth StocksGrowth stocks refers to the stocks of companies that are expected to grow at a faster rate than the industry average and report consistent and sustainable cashflows. The company sales and revenues are also expected to increase at a faster than that of an average company in the same industry.
Penny StocksThese are also referred to as micro-cap or nano-cap stocks and refers to the stocks of relatively small companies valued less than $5 and only trade via the Over-The-Counter markets.
Blue ChipA blue chip refers to a nationally recognized and financially sound company with a long and stable record of consistent growth. It is company whose financial might and nature of operation make it well suited to face turmoil and remain profitable in the uncertain economic conditions..
Short SellingShort selling is a trade/investment strategy where the investor is banking on the decline of the shares of a particular company. They therefore borrows these shares, sells them at the current market price and buys them back after they lose value, effectively profiting from the price difference.
YieldYield refers to the profit/earnings generated from investing in a particular stock or market instrument over a given period of time and is expressed a percentage of the stock’s market value, face value or as percentage of invested amounts.
Capital StockCapital stock, also referred to outstanding shares, refers to all the regular shares issued by a company and held by all its shareholders including the restricted/locked-in shares held by company insiders, executives, and institutional investors. The number of capital stock is used in calculating key metrics including cash-flow per-share and earnings per share.
Earnings Per Share (EPS)EPS refers to the monetary value, the profit or earnings attributable to each outstanding shares held by a company. It is a financial ratio that is arrived at by dividing the company’s profit by its outstanding shares of the common stock.
Price Earning Ratio (PER)Also referred to as Price-to-earnings ratio, PER is a financial metrics tools used to check if a company’s shares are over/undervalued by dividing the shares current market price with its earnings-per-share.
FloatA company’s flat refers to the number of regular shares issued to investors that are available for trading. The float shares figure is arrived at by subtracting the locked-in shares held by company insiders and executives from its capital stock.
Gap-up StocksGap up stocks refer to company stocks that open the day trading at relatively higher prices than their previous day’s closing price. This is often attributed to the after-market trading activity.
Gap-Down StocksGap down stocks refers to company stocks that open the day trading at relatively lower prices that the previous day’s closing price. For instance if a company stock closes the day trading at $50 but opens the following day trading at $45, it is said to have a 5-point gap down.
Stock BuybackStock buyback, also referred to as share repurchase, occurs when a publicly listed corporation uses a part of its revenues to buy back its shares from the marketplace. The move effectively reduces the number of company shares in circulation, which translates to an increased share price.
HOLDHOLD is a financial recommendation issued by a qualified financial institutions or financial analyst advising investors/traders not to buy or sell a particular stock. It is a no-action situation where long position traders are advised not to sell and others investors advised not to buy into the stock.
Resistance LevelsThis refers to the upper-most price level that a particular stock or any other security reaches but doesn’t exceed due to dwindling number of buyers and an increasing number of sellers.
MacroeconomicIs a branch of economics that’s concerned with the study of how the economy and different large-scale markets are structured, how they behave, and how they perform.
RSIRelative Strength Index is a technical momentum indicator used in market analysis to determine if a stock is overbought or oversold by measuring the magnitude of a recent bullish or bearish price run. It has a scale of 0-100 where RSI readings of 70+ indicate a stock is overbought while an RSI reading below 30 is an indicator of an oversold security.
Moving AverageMoving Averages is a statistical calculation that is specially designed to identify the arithmetic mean of a given number of data sets or range of prices calculated over a given period of time. Each of these data set or price range is created by the average/mean price for that subset. For instance, a single data point on a moving averages scale may represent the average stock price for a day or trading session.
Bollinger BandsBollinger Bands are a technical indicator tool characterized by two statistical carts that run alongside each other indicating the changes in prices and volatility of a financial instrument like stock or commodity over a given period of time.
Fibonacci RetracementsFibonacci retracements refer to two horizontal lines that use the Fibonacci numbers to measure the percentage of price retracement in a bid to indicate where the resistance and support are most likely to occur.
Conclusion
Trading stocks is a learning process. You should not expect to profit on every single trade and the integration of a good risk-reward ratio of 1:2 or 1:3 is mandatory if you want to succeed. Nevertheless, there are many benefits to trade stock CFDs. Some of the advantages include a high leverage ratio, a low initial deposit, low fees and commissions, and an easy registration process. Moreover, the ability to use the CopyTrading feature, social trading, and automated trading make CFD brokers a better choice than traditional brokerage firms when it comes to stock trading.
Trade with eToro - World Leading Social Trading Platform
Our Rating

- Trade Stocks, Forex, Crypto and more
- 0% Commission on Real Stocks
- Copy Trades of Pro Investors
- Easy to Use Trading Platform
67% of retail investor accounts lose money when trading CFDs with this provider. You should consider whether you can afford to take the high risk of losing your money.FAQ
Why trade CFDs instead of stocks?
Trading CFDs and stocks on an exchange is a very similar type of trading except for the fact that when you trade CFDs, you don’t own the underlying asset. In that sense, if you are looking to speculate on the price of stocks, then CFDs can be a great solution. The margin requirements are lower, there’s no minimum amount of capital required to day trade, you can short the stock without the requirement to deliver the stock, and you can deposit a lower initial deposit in order to start trading.
How much money do I need to invest to start trading stocks?
Well, if you choose to start trading through a CFD broker such as eToro or Plus500, you will have to deposit a minimum of $200 or $100 respectively. If you are based in the US, you can start trading with $5 through Stash Invest. Yet, brokerage firms typically want an effective cushion against margin calls so it is recommended to start trading with a higher amount of capital of around $500-$1000.
Do you get dividends from CFDs?
Surprisingly, yes. If you own a CFD on a certain stock you will receive a dividend into your trading account if you owned the CFD the day before the ex-dividend date.
Are CFDs safe?
Recently, many top regulators around the world have begun to tighten up regulation on the CFD market. Brokers like eToro and Plus500, for example, are highly regulated by top-tier regulators. That means that regulated brokers must comply with a set of rules to ensure clients’ protection.
What are the risks involved in stock trading?
Regardless of the level of your trading experience, there is always a certain risk involved in stock trading as the markets are unpredictable. The Black Swan phenomenon is very useful to identify unpredictable events such as the 2008 economic crisis and the recent coronavirus pandemic. Eventually, the main risk involved in stock trading is to lose your capital as well as the time you have invested in it.
Our Full Range of “Buy Stocks” Resources – Stocks A-Z

Tom Chen
Tom Chen
View all posts by Tom ChenTom is an experienced financial analyst and a former derivatives day trader specialising in futures, commodities, forex and cryptocurrency. He has a B.A. in Economics and Management and his work has been published on a range of publications, including Yahoo Finance, FXEmpire and NASDAQ.com.
WARNING: The content on this site should not be considered investment advice. Investing is speculative. When investing your capital is at risk. This site is not intended for use in jurisdictions in which the trading or investments described are prohibited and should only be used by such persons and in such ways as are legally permitted. Your investment may not qualify for investor protection in your country or state of residence, so please conduct your own due diligence. Contracts for Difference (“CFDs”) are leveraged products and carry a significant risk of loss to your capital. Please ensure you fully understand the risks and seek independent advice. This website is free for you to use but we may receive commission from the companies we feature on this site.
Copyright © 2026 | Learnbonds.com
We use cookies to ensure that we give you the best experience on our website. If you continue to use this site we will assume that you are happy with it.Scroll Up