What is CFD Trading? How to Trade CFDs in 2026
The trading of Contract for Difference (CFD) assets is now a popular feature on many forex trading platforms. A CFD is a derivative contract which is based on the differences in the price of the underlying asset over time.
The buyer of the CFD hopes to profit if the price at which the contract ends is higher than the price at which he/she bought the contract.
The seller of the CFD hopes to gain if the price at which the CFD asset is sold is higher than the price at which the contract ends. In all CFD transactions, no physical exchange of the asset is carried out between the dealer and the trader.
-
-
Step 1: Open a CFD Trading Account
1. Fineco Bank
Fineco Bank is an Italian broker that operates across Europe, including in the UK. The platform offers CFD trading on more than 10,000 shares from the US, UK, and Europe, as well as trading on forex, stock indices, and commodities.
A big draw to Fineco Bank is its inexpensive pricing. Share CFD trading is commission-free and the broker doesn’t add any spreads that can eat into your profits. Spreads for index CFD trading start at just 0.4 pips and spreads for forex CFD trading start at 0.8 pips, which is below the industry average. Fineco Bank also doesn’t charge deposit, withdrawal, or inactivity fees.
Fineco Bank provides traders with the PowerDesk trading platform as well as a mobile app. PowerDesk is packed with features, including dozens of technical indicators and drawing tools, a market news feed, and an economic calendar. The mobile app isn’t as comprehensive for analyzing price movements, but you can easily place trades on the go and monitor your open positions.
Fineco Bank is regulated by the Bank of Italy and is traded on the Milan Stock Exchange.
How to start CFD trading on Fineco Bank:
Step 1: Create a free CFD trading account on the Fineco Bank website. You’ll need to enter details about your name, location, trading experience, and financial history. You can use the code FIN100-AD to get 100 free trades!
Step 2: Verify your identity by uploading a copy of your driver’s license or passport. This is required by Fineco Bank to comply with government regulations.
Step 3: Fund your trading account with a bank transfer. Fineco Bank doesn’t require a minimum deposit.
Step 4: Use PowerDesk or the Fineco Bank app to find instruments to trade.
Step 5: Start trading CFDs.
Our Rating

- Trade over 10,000 shares from the US, UK, and Europe
- Advanced PowerDesk trading platform
- Commission-free CFD trading with low spreads
- 100 free trades
- 100 free trades
- Limited technical analysis on mobile app
Your capital is at risk. Sponsored ad2. Cryptorocket
Cryptorocket is one of the most recent and most advanced entrants into the CFD trading scene. It also has one of the most advanced trading platform, riddled with equally advanced trading tools and features.
Unlike most other CFD brokerages, however, cryptorocket is crypto based and will only support crypto transactions implying that you can only deposit funds into your cryptorocet platform in the form of bitcoins or other cryptocoins. Some of Cryptorockets key features include commission-free live trades on the platform, no deposit fees, and no transaction fees.
You also get to trade a selection of tradeable securities that include crypto, forex, indices, and stock CFDs. Moreover, you get to trade via their web trader or the all-popular MT4 platforms.
How to trade CFDs on cryptorocket:
Step 1: Create a free CFD trading account on the Cryptorocket website
Step 2: Complete registration by filling in your personal information as trading name and email.
Step 3: Complete the KYC verification process by furnishing the broker with copies of your official identification documents
Step 4: Fund your account with a minimum $10 using one of the supported payment methods.
Step 5: Start trading CFDs
Our Rating

- Highly advanced trading platform with equally advanced trading features
- Cryptorocket maintains some of the friendliest trading fees
- Maintains a relatively affordable minimum initial deposit
- Cryptorocket isn’t a regulated broker
- The broker only supports a limited number of trading platforms
Sponsored adStep 2: Understand the key Aspects of CFD Trading
To trade CFDs, the trader must have a knowledge of technical and fundamental analysis. Access to news feeds and market research tools can be critical. CFDs can be traded intraday, or can be traded on a swing trading basis. Due to the fact that CFD contracts expire, position trading (i.e. keeping positions open for months or even years) is not advised. Here is an explanation of the factors that a trader must consider to trade CFDs:
-
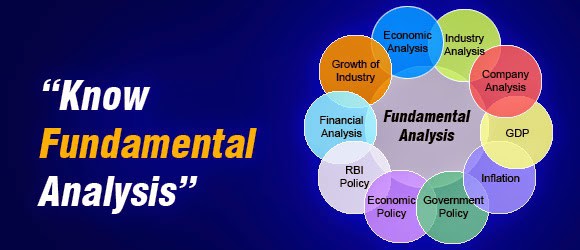
Fundamental analysis
Each category of CFDs has its own specific fundamentals. Therefore, the news that will move the prices of crude oil for instance, is not the same news that will move a stock like Baidu or Apple. Therefore, an understanding of the fundamentals for each CFD category is required.

News that tend to cause movements in stock prices include the following: earnings reports, new product release, favourable news such as approval of medications, treatments and clinical trials (biotech stocks), negative news such as product recalls, appointment/exit/death of a major player in the company’s management, etc. It must also be pointed out that some systemic news that affect entire sectors or exchanges can affect prices of stock CFDs listed in an entire sector.
For commodity CFDs that are agriculture based, factors of supply and demand are the key drivers of price. Any factor that causes an increase or reduction in supply or demand will affect prices. Factors such as extreme weather patterns (hurricanes, cyclones, etc), drought, natural disasters (e.g. flooding), disease outbreak or civil war, have the potential to reduce supply of agricultural commodities and therefore cause an increase in global prices. Ivory Coast is the world’s largest cocoa producer. When there was post-election strife in that country in 2011, supply of cocoa was affected and prices of cocoa skyrocketed in the international market.
Prices of metal CFDs are also affected by forces of demand and supply. Factors such as reduced manufacturing and reduced economic growth will cause a reduction in demand for raw materials such as copper, silver and platinum, used for industrial production processes. A slowdown in Chinese growth some years ago caused a collapse in copper prices as a result of reduced demand. We also saw prices of gold and platinum spike in the international market when a prolonged miner’s strike in South Africa struck the major metal miners.
Energy assets such as crude oil and natural gas are also subject to environmental factors, political and economic situations in the countries where production is highest (e.g. Middle East) and the US Crude Inventory report. The annual meetings of oil ministers from the Organization of Petroleum Exporting Countries (OPEC) and the proclamations from this body on production quotas for member states are two major movers of oil prices.
-
Technical Analysis
CFD assets lend themselves to technical analysis. Technical analysis is the use of information on the price charts to predict future behavior and price movement of financial assets. Due to the fact that every asset classified as a CFD can be plotted on a chart which shows price on the y-axis and time on the x-axis, various methods of technical analysis can be used.

Technical analysis involves the use of various tools such as retracement tools, line tools, chart patterns, candlesticks and indicators (trend, momentum and volume). Also critical to the use of technical analysis is information as to what traders are buying or selling particular CFDs, and the volumes in which they are buying those CFDs. This information is derived from the Commitment of Traders (COT) Reports, and also found in the Depth of Market tool found on some trading platforms such as the latest version of the MT4 and the MT5 platforms.
We will describe the use of some of these tools in the CFD trading examples that will be described later in this article.
-
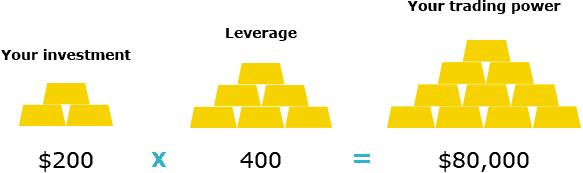
Leverage/Margin Requirements
CFDs are leveraged products. This means that the traders can borrow trading capital from the brokers in specified amounts. In the UK and EU, regulators have pegged the leverage that can be provided to retail traders at the following levels:

1:2 for cryptocurrency CFDs
1:5 for stocks CFDs
1:10 for commodities CFDs other than gold and non-major equity indices
1:20 for non-major currency pairs, gold and major indices.Professional traders on EU and UK platforms do not have leverage restrictions, and it is not unusual to see leverage of up to 1:300 being provided for CFD trading.
In Australia, leverage of up to 1:500 is allowed for CFD trading. However, leverage will oscillate between 1:50 and 1:500 for various CFD categories. For instance, AvaTrade has a branch in Australia which offers the following leverages:
It must be pointed out that several EU and UK brokers have international branches, which are used to provide higher leverage conditions for international clients. Depending on which part of the world you operate from, these brokers can offer you more flexible leverages for your CFD trading purposes.
-
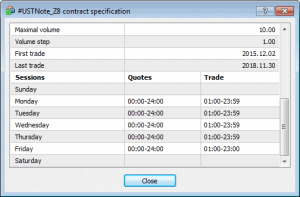
Contract Specifications

Every broker provides the contract specifications and it varies from broker to broker. It usually contains the list of CFDs available for trading, minimum and maximum volumes that can be traded, leverage, stop out level, spread charges, commissions, etc.
It is very important for a trader to study the contract specifications before trading CFDs with the broker. This is because it contains all the trading conditions, trading costs and other fees charged by the broker.
Step 3: Choose a Trading Strategy and Start Trading
In this section, we shall be showcasing some CFD trading examples, drawn from various CFD asset classes.
CFDs are basically traded in two directions. For buyers, profits are made if the trade ends at a price that is higher than the entry price. For sellers, profits are made when the trade ends at a price that is lower than the entry price.
The basic tenets of CFD trading are as follows:
- Market research which looks at macro factors that are currently at play and what the news is saying about the CFD asset itself, the sector it is listed or the category that it belongs to in its market.
- Viewing the factors that show the commitment of traders (or lack of it) for any CFD assets you are interested in.
- Analyzing the charts for technical plays such as the current trend, and other setups that follow the trend.
- Performing the trade entry with the correct order type.
- Setting a trade exit point.
- Using appropriate protection stops.
- Risk management
Here is a suitable trading strategy we will use to demonstrate CFD trading.
Trading CFDS Using the Pivot Range
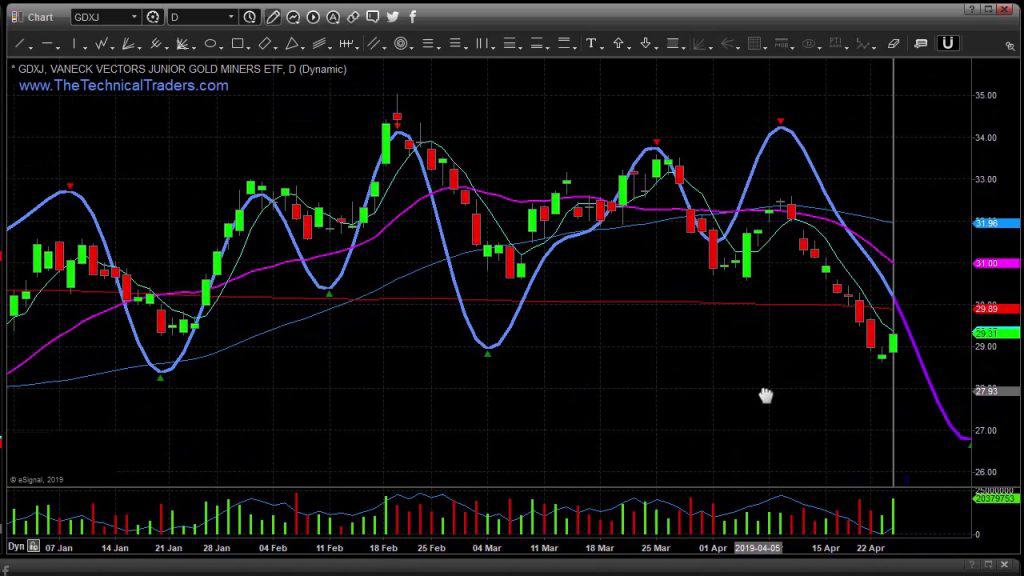
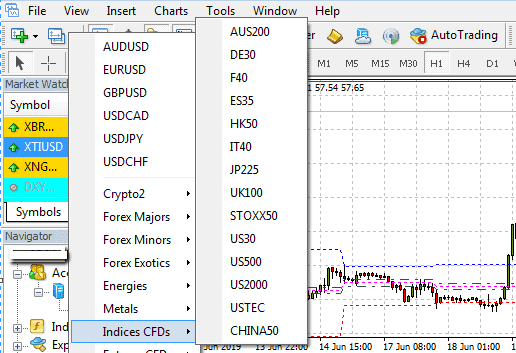
Some of the CFD markets are not 24-hour markets. Stocks and indices are only traded for a few hours a day. So you can actually trade these on an intraday basis. US stocks are among the most popular stock CFD assets, and you will find these on many MT4 and MT5 platforms. Examples are shown in this chart below:

So what strategy can be used to trade stocks or index assets?
The daily pivot range strategy can be used to trade stock CFDs and index CFDs as well, and is best used when there is no earnings report around the corner which could possibly distort the trade parameters. How is this strategy traded?
This strategy depends on the use of a custom indicator known as the daily pivot range indicator. This indicator is used to feel the pulse of the market by detecting the “pivot range”; a concept that was described by Mark Fisher in the book “the Logical Trader”. The range is calculated as follows:
- Calculate the daily pivot number by adding the High, Low and Close prices of the previous day and divide the total by 3.
- Add the high price and low price, then divide the sum by 2.
- Subtract (b) from the daily pivot number, and that gives the pivot differential.
- The pivot range is the pivot number +/– the pivot differential.
Assuming the previous daily candle of a stock XYZ had a high of 50, a low of 40 and a close of 46, what is the pivot range?
- The daily pivot number is (50 + 40 + 48)/3 = 46
- (High + Low)/2 = (50 + 40)/2 = 45
- The pivot differential is 46 – 45 = 1
- The daily pivot range is 46 + 1, or 46 – 1. This leaves the range as starting from 45 to 47.
Using the daily pivot range, we can detect the buying or selling sentiment for the new day by comparing the previous day’s closing with the calculated pivot range. The pivot range indicator will draw lines that mark the borders of the pivot range on the charts.
Strategy
The pivot range indicator is applied to the 1 hour chart only. If the previous day’s closing price is located above pivot range, this is considered a bullish sentiment. If the previous close is below the pivot range, this is considered a bearish sentiment. Having defined the borders of the pivot range using the indicator, the next step is to watch for the behavior of the price action with respect to the pivot range.
1.Long Trade
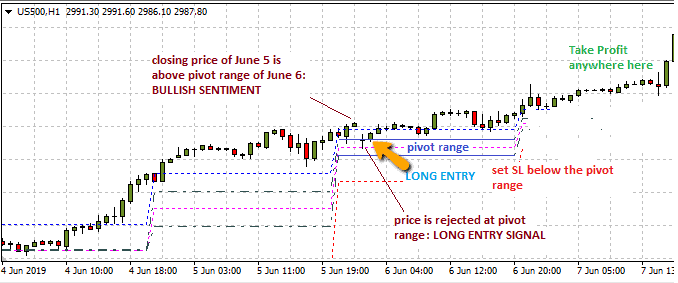
If there is existing bullish bias (i.e. previous day’s close is above the pivot range), wait for price to come down to meet the pivot range’s upper border. The pivot range is expected to act as a price support. If the price bounces on the upper border of the pivot range, go long at the open of the next candle. This scenario is displayed in this hourly chart for the S&P500 CFD asset (US500).

As we can see, the June 5 2019 price action closed above the pivot range for that day. This close was also higher than the pivot range for June 6, which gave the market a bullish bias. Price retreated and was rejected at the pivot range’s upper border, thus providing the basis for a long trade. The long trade is entered at the open of the next candle, with the stop loss being set below the pivot range and the profit target being set above the pivot range at a point which corresponds to at least 2 times the stop loss target, or a historical candle high.[/toggle]
2. Short Trade
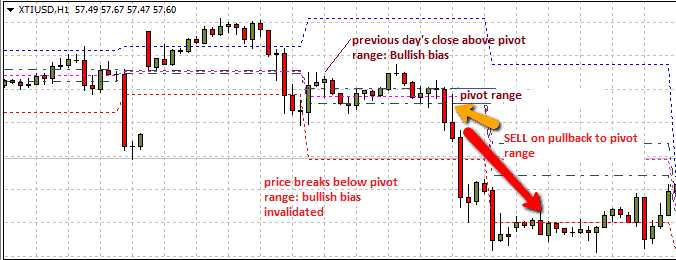
If there is existing bearish bias (i.e. previous day’s close is below the pivot range), wait for price to move up to meet the pivot range’s lower border. The pivot range is expected to act as a price resistance in this instance. If the price is rejected at the pivot range’s lower border, short the asset at the open of the next candle. Another scenario may also play out. If the previous close is above the pivot range (bullish bias), but the price is able to go through the pivot range and ends up below it, this invalidates the bullish bias and converts to a bearish one. This is akin to a situation where price breaks a support, converting that level to a new resistance. Allow price to pull back to the broken pivot range, and short the asset when the price touches the pivot range’s lower border. See the chart below for this setup.

Trader Benjie intends to carry out a day trade on the WTI crude oil CFD contract. Using the setup described above for the short trade, he decides to initiate a short trade at 58.58, which is the price at which a pull back to the pivot range is completed. He decides to short 1000 CFD contracts at this price. Using a leverage of 1:100 on an Australian CFD broker, he will only need to commit a margin of 1% of the total contract cost to the trade. Cost of the crude oil contract is 1,000 X 58.58, which is $58,580. 1% of this sum is $585.80.
Stop Loss: The pivot range is the critical barrier used in setting the stop loss. Once price crosses to the other side of the pivot range, it changes market sentiment. Therefore, the stop loss for this trade is set above the pivot range, which is at a price level of $59.30. This price is above the highest high of the candles on the upper side of the pivot range.
Take Profit: Profit targets should be at least 2 or 3 times the set stop loss. However, it is essential to use a previous low in setting the profit target for a short trade. A previous low was seen at 55.90 on 19th June, and this is the area that will be used as the profit target for the trade.
Risk-reward ratio: From the trade settings (entry and exit prices, including protection stops), what is the risk-reward ratio for this trade?
- Entry price is 58.58
- Stop loss is set at 59.30. This is equivalent to 72 pips (59.30 – 58.58)
- Take Profit is set at 55.90. This is equivalent to 268 pips (58.58 – 55.90)
- Risk-reward ratio is 1:3.7, which is a healthy risk-reward ratio setting.[/toggle]
Note: CFD trading may have opened up money, shares, and commodity markets to virtually everyone with a few dollars and access to the internet. But there is more to CFD trading than just leverages and ease of trading. It is an art that calls for a delicate balance between profit maximization and risk avoidance.What are some of the CFD Trading Assets?
Today, CFDs are traded on various classes of assets. These assets classes include:
- Commodities (metals, energy assets and agricultural assets)
- Exchange Traded Funds (ETFs)
- Bonds among others

Indeed, tens of thousands of CFDs exist, as these asset categories feature assets that are found all over the world. The section below discusses the various asset types, which are distinguished on the basis of their individual characteristics and the underlying markets in which they are traded. Each asset class has its own special characteristics which set it apart from the others. These CFD trading assets are described briefly below.
Shares and stocksIndicesBondsETFsCommoditiesDigital AssetsShares of companies can be traded as CFDs. This means that the trader can buy a contract which aims to predict that the price of a stock will either rise or fall without actually owning the stock in question. Stocks constitute the largest CFD class because of the sheer numbers of listed stocks on national exchanges across the world.
An index is a weighted measurement of the daily performances of a national stock market. The name of the index gives an idea as to the number of stocks that are used in performing the weighting measurement. Popular stock indices are the S&P500, Dow Jones (DJ30), Nasdaq (NDX100), Xetra DAX and FTSE100. The changing values of the stocks used in performing the weighting will impact the value of the index, causing it to rise or fall. Index traders are required to monitor the performance of the heavy movers as far as the listed stocks are concerned, as these will have a stronger impact on market performance of the index in question.
Bonds are debt instruments issued by governments or companies in exchange for borrowed funds. They are also known as Treasury Bills or Treasuries. Bond prices have an inverse relationship with long-term interest rates (bond yields) and also have an inverse relationship with stock market indices. The popular bond CFDs in the market are those which feature the US Treasuries as well as the German government bonds.
Exchange-traded funds (ETFs) are composite baskets of financial assets drawn from several asset classes. They are traded like stocks and provide exposure to several markets at once. A few brokers offer ETFs as CFDs, so that traders can trade contracts based on their prices and not have to buy the ETFs themselves.
Various brokers will determine what kinds of CFD trading assets their clients will be offered. Usually, trading experience of clients will be accessed by brokers before they are allowed to trade certain CFD trading assets.
Commodities can be classified as hard or soft commodities. On many trading platforms, a distinction is now being made as follows:
- Energy assets: crude oil, natural gas, heating oil
- Agricultural commodities: corn, coffee, cotton, cocoa, sugar, wheat, etc.
- Metals: gold, silver, copper, platinum, palladium, etc.
Commodities are usually used as raw materials in many industries around the world and they tend to have very wide price variations. They can also be very volatile.
Crypto trading is an emerging class of CFDs which features some of the world’s top cryptocurrencies such as Bitcoin, Litecoin, Ethereum, Stellar Lumens, NEO, Monero, Bitcoin Cash and Dash. Cryptocurrencies are extremely volatile and to be able to trade them as CFDs, the CFD trader will require a well-capitalized account. The BTC/USD pair has the highest spreads and the largest margin requirement of all crypto CFDs. Other cryptocurrency pairs come with spreads that are not very high and do not require much margin to trade.
What are the trading characteristics of CFDs?
- A CFD is a contract between a dealer and a trader to exchange the difference in value of a financial instrument between the time of trade entry and the time of contract expiration.
- If the closing price is higher than the opening price, then the seller will pay the buyer the difference, and if the exit price is lower than the entry price, the buyer pays the seller the difference.
- There are various asset classes of CFDS such as stocks, commodities, indices, ETFs, bonds and cryptocurrencies.
- FD trading is highly leveraged. In Europe and the UK, leverage on CFD is restricted to no more than 1:10 for non-volatile CFDs, and 1:5 for volatile CFDs (e.g. stocks). In Australia, brokers still offer CFD trading using leverages as high as 1:100.
- The prices of CFD instruments quoted on the broker platforms reflect the actual prices of the underlying assets.
Factors to Consider When Trading CFDs
Before engaging in CFD trading, you must consider certain factors. These are stated below.
I. Regulation and Security:
Is your CFD broker regulated? Regulation of CFD brokers is all about trader protection, security of traders’ funds and provisions of a transparent trading environment. If these are not provided by a regulated entity, you can file a complaint about such a broker to the regulators for intervention. Regulators across the world have been intervening in cases of broker infraction. Where regulation is absent, there is no place for the aggrieved trader to turn to.
II. Margin Requirements:
Margin requirements are a function of the leverage provided by the CFD broker. This will directly affect your ability to trade certain CFDs. For instance, CFD trading on a UK/EU brokerage platform comes with tighter leverage caps than you would find with an Australian broker. You may be able to trade a stock CFD with a leverage of 1:100 on AvaTrade AU. What are the margin requirements in both cases? Let us assume you want to buy 2,000 units of a stock, and it will cost $10,000 to buy them. A leverage of 1:5 is a margin requirement of 20%, which means that you will need $2,000 to execute the trade in question. If you use a leverage of 1:100 on an AU brokerage such as AvaTrade, the margin requirement is 0.01%, which means that you will need $100 to execute the same trade. So you must understand what your margin requirements are in order to ensure your trading account is well capitalized for your leverage levels.
III. Trading tools:
It is important to have access to the right trading tools for CFD trading. You should for instance, have access to the COT report, access to great news feeds (such as from Reuters and Bloomberg), instant squawk news, Twitter feeds that provide up to the moment news and market research from sources such as Trading Central.
The bottom line
The CFD trading popularity has surged in recent few years largely due to the establishment of more technologically advanced trading platforms. This, plus the flexibility, lower fees, leverages, and convenience offered by these platforms like the ability to benefit from both rising and falling markets by going long or short on a particular share stock or commodity. However, most of these benefits – especially the high leverages and ease of accessing the markets – are also its biggest downfall as they are the leading causes of overtrading. Every CFD trader must, therefore, keep in mind that succeeding here takes more than just the mastery of the different analysis techniques or best trade entry and exit points. It must also involve the mastery of your trading limits with regards to the use of leverage and number of positions you can effectively execute at a go.
Glossary of CFDs Terms
Platform FeeThe trading platform fee refers to the amount a trader pays to use the platform and access its integrated platform features and tools. It can be a one –time fee paid for the acquisition of the trading platform, a subscription fee paid monthly or annually. Others will charge on a per-trade basis with a specific fee per trade.
Cost per tradeCost per trade is also referred to as the base trade fee and refers to the fee that a broker or trading platform charges you every time you place a trade. Some brokers offer volume discounts and charge a lower cost per trade for voluminous trades.
MarginMargin is the money needed in your account to maintain a trade with leverage.
Social tradingSocial trading is a form of trading that allows for the interaction and exchange of trade ideas, signals and trade settings between the different classes of traders.
Copy TradingCopy trading, also known as mirror trading is a form of online trading that lets traders copy trade settings from one another. In most cases, it is the newbies and part-time traders that copy the positions of pro traders. The copiers -in most cases - are then required to surrender a share of the profits made from copied trades – averaging 20% - with the pro traders.
Financial instrumentsA Financial instrument ideally refers to the proof of ownership of financial commodities of monetary contracts between two parties. In the money markets, financial instruments refer to such elements as shares, stocks, bonds, Forex and crypto CFDs and other contractual obligations between different parties.
IndexAn index is an indicator that tracks and measures the performance of a security such as a stock or bond.
CommoditiesCommodities refer to raw materials used in the production and manufacturing of other products or agricultural products. Some of the most popular commodities traded on the exchange markets include energy and gases like oil, agricultural products like corn and coffee, and precious metals like gold and silver.
Exchange-Traded Funds (ETFs)An ETF is a fund that can be traded on an exchange. The fund is a basket containing multiple securities such as stocks, bonds or even commodities. ETFs allow you to trade the basket without having to buy each security individually.
Contract for difference (CFD)CFDs are a form of contractual trading that involves speculating on the performance of a particular trade in the market. CFD’s will basically allow you to speculate on the future value of securities such as stocks, currencies and commodities without owning the underlying securities.
Minimum investmentThe minimum investment simply refers to the lowest amount of capital injection you can deposit into a brokerage or a trading platform. Different brokers demand varied minimum investment amounts from their clients either when registering or opening trade positions.
Daily trading limitA daily trading limit is the lowest and highest amount that a security is allowed to fluctuate, in one trading session, at the exchange where it’s traded. Once a limit is reached, trading for that particular security is suspended until the next trading session. Daily trading limits are imposed by exchanges to protect investors from extreme price volatilities.
Day tradersA day trader is a term used to describe a trader who is constantly opening trades and closing them within a day. It is a common term used to refer to forex traders who open trade and only hold onto it for a few minutes or hours before disposing and having to leave no open trades at the time the trading day closes.
FAQs
What is a Contract for difference (CFD)?
A contract for difference (CFD) is an agreement that enables the trader to speculate on rising and falling prices of fast moving global financial instruments like shares, indices, commodities, cryptos and bonds.
Is CFD trading the same as forex?
CFD trading involves different types of contracts which cover a set of markets like indices, energy, metals, cryptos and stock shares but forex trading offers only the trading of currencies.
How do CFD traders make money?
CFD trading allows a trader to profit on a bi-directional basis. Buyers can profit when they go long at lower prices and exit trades at higher prices. Sellers profit when they short CFD assets at higher prices and exit their trades at lower prices.
Do CFD contracts expire?
Cash based CFDs do not expire but futures-based CFDs have expiry dates which are stated on the contract specifications. So CFDs on shares, indices and ETFs do not have expiry dates but CFDs on commodities, bonds and futures have expiry dates.
How much do I need to trade 1 contract of a CFD on Plus500?
It depends on your country of residence and on the CFD asset group that you wish to trade. On the EU platform of Plus500, you need 5% margin to trade gold, 10% on commodities, 20% on major equities and 50% on cryptocurrencies. So if a Gold position costs $3000 to setup, you would need at least $150 to initiate the trade. But, if you are not from ESMA jurisdiction and on the global site of Plus500, you will only need a margin of 0.667%.
How do I trade CFDs?
Open and fund an account with a broker such as Plus500 or AvaTrade. Decide which CFD asset to buy or sell. Go to the broker’s trading platform. Select your trade size, add a stop loss if you wish. If you think that the price will increase in value, click ‘buy’. But if you think that the price will fall, click ‘sell’. Monitor and close your trade at the right time.
See Our Full Range Of Trading Resources – Traders A-Z

Edith Muthoni
Edith Muthoni
View all posts by Edith MuthoniEdith is an investment writer, trader, and personal finance coach specializing in investments advice around the fintech niche. Her fields of expertise include stocks, commodities, forex, indices, bonds, and cryptocurrency investments. She holds a Masters degree in Economics with years of experience as a banker-cum-investment analyst. She is currently the chief editor, learnbonds.com where she specializes in spotting investment opportunities in the emerging financial technology scene and coming up with practical strategies for their exploitation. She also helps her clients identify and take advantage of investment opportunities in the disruptive Fintech world.
WARNING: The content on this site should not be considered investment advice. Investing is speculative. When investing your capital is at risk. This site is not intended for use in jurisdictions in which the trading or investments described are prohibited and should only be used by such persons and in such ways as are legally permitted. Your investment may not qualify for investor protection in your country or state of residence, so please conduct your own due diligence. Contracts for Difference (“CFDs”) are leveraged products and carry a significant risk of loss to your capital. Please ensure you fully understand the risks and seek independent advice. This website is free for you to use but we may receive commission from the companies we feature on this site.
Copyright © 2026 | Learnbonds.com
We use cookies to ensure that we give you the best experience on our website. If you continue to use this site we will assume that you are happy with it.Scroll Up