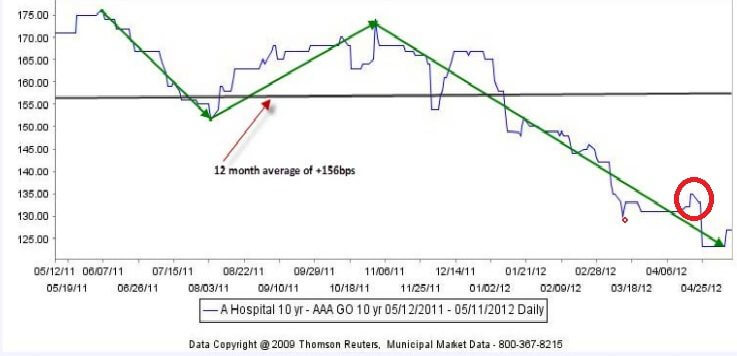
 (June 2012) Technical analysis is using market price data, usually displayed in a chart, to try and predict future price movements. To predict future price movements, there are two central tenets:
- Inertia – You will often hear technical analysts say things like “Don’t fight the trend” and “Don’t Try to catch a falling knife” which capture the spirit of the inertia tenant. Basically, you want to be long when the market is rising and short or flat when the market is falling.
- Reversion To Mean – Markets tend to overshoot the “real” value of a security during any strong directional move up or down. As a rally or sell-off loses steam, saner heads prevail. This usually leads to a more rational assessment of value and creates a move in the opposite direction.
There are Several Problems with Technical Analysis For Municipal Bonds
- Not Enough Data – To know the trend, you need to know the price history. Most municipal bond issues trade relatively infrequently which means that price data for them can be difficult to interpret . This problem can be solved by looking at groups of bonds of a similar type and combining the price data.
- Interest Rate Changes Can Overwhelm Relative Price Movements – The primary driver of all bond prices, including municipal bonds, is the overall interest rate environment. Without adjusting for interest rates, detecting meaningful trends in market data is very difficult. To do detailed market analysis municipal bond market professionals talk about a spread against a yield curve of AAA General Obligation (GO) State Bonds. When a bond has a spread of +100 bps its yield is 1.0% (100 bps) more than the average AAA yield for its maturity. This allows market participants to discuss relative changes of value between different types of municipal bonds.
Do Hospital Bonds Look Overbought?
Daniel Berger, a senior market strategist for Thomson Reuter’s Municipal Market Data (MMD), issued a report on May 11, 2012, “The Lower Spreads For Hospital Bonds Might Make You Sick”. He argues that hospital bonds currently look expensive; the spread over the AAA yield curve is too small, by historical measures. (All numbers are as the date of this report)
- 10 Yr “A Rated” Hospital Bonds Are Trading Around +127bps more than MMD’s AAA (GO) Yield Curve
- The average has been +156bps for the last 12 months (+166bps since the collapse of Lehman Brothers.)
- The current level is at or close to a low for the last 12 months.

If hospital bonds revert back to their average level for the last 12 months, the spread could rise by 30 bps. While the report clearly indicates that hospital bonds look oversold compared to historical averages, it does not clearly establish the technical downward trend is over. A classically trained technical analyst would want confirmation that the downtrend was over from the following data:
- The price bouncing off a bottom price “support level” several times over a period of time.
- Some previous high or low being crossed as the price rises (in this case the recent high of 140 bps hit in the middle of April might be a positive signal).
- Decrease in trading volume on days when the price falls. Increases in volume on days when the price rises. (this would be difficult to determine for only hospital bonds)
Please note:Berger stated that since this report was written this spread has steadily increased and closed on June 8th at +137bps.
Whats the Bottom Line?
For more on municipal bonds visit the municipal bond section of learn bonds.
Trusted & Regulated Stock & CFD Brokers
What we like
- 0% Fees on Stocks
- 5000+ Stocks, ETFs and other Markets
- Accepts Paypal Deposits
Min Deposit
$200
Charge per Trade
Zero Commission on real stocks
64 traders signed up today
Visit Now67% of retail investor accounts lose money when trading CFDs with this provider. You should consider whether you can afford to take the high risk of losing your money.
Available Assets
- Total Number of Stocks & Shares5000+
- US Stocks
- German Stocks
- UK Stocks
- European
- ETF Stocks
- IPO
- Funds
- Bonds
- Options
- Futures
- CFDs
- Crypto
Charge per Trade
- FTSE 100 Zero Commission
- NASDAQ Zero Commission
- DAX Zero Commission
- Facebook Zero Commission
- Alphabet Zero Commission
- Tesla Zero Commission
- Apple Zero Commission
- Microsoft Zero Commission
Deposit Method
- Wire Transfer
- Credit Cards
- Bank Account
- Paypall
- Skrill
- Neteller
What we like
- Sign up today and get $5 free
- Fractals Available
- Paypal Available
Min Deposit
$0
Charge per Trade
$1 to $9 PCM
Visit Now
Investing in financial markets carries risk, you have the potential to lose your total investment.
Available Assets
- Total Number of Shares999
- US Stocks
- German Stocks
- UK Stocks
- European Stocks
- EFTs
- IPOs
- Funds
- Bonds
- Options
- Futures
- CFDs
- Crypto
Charge per Trade
- FTSE 100 $1 - $9 per month
- NASDAQ $1 - $9 per month
- DAX $1 - $9 per month
- Facebook $1 - $9 per month
- Alphabet $1 - $9 per month
- Telsa $1 - $9 per month
- Apple $1 - $9 per month
- Microsoft $1 - $9 per month
Deposit Method
- Wire Transfer
- Credit Cards
- Bank Account


