The HYG and JNK are often mentioned in the same breath as Bond ETFs that give high yield bond market exposure. If you are looking for a high yield bond fund for your portfolio then both funds are worth a look. However there are a few differences worth looking at which we have outlined below.
| ETF | HYG | JNK |
| Issuer | iShares | State Street |
| Fund Objective | to mirror the performance of the iBoxx $ Liquid High Yield Index. | to mirror the performance of the Barclays Capital High Yield Very Liquid Index |
| Index Tracked | iBoxx $ Liquid High Yield Index | Barclays Capital High Yield Very Liquid Index |
| Duration | 3.92 | 4.27 |
| Tracking Error | .47% | .38% |
| Expense Ratio | .50% | 0.40% |
| Total Assets | 16.13 Billion | $11.92 Billion |
| Average Daily Volume | 3.7 Million Shares | 5.5 Million Shares |
| Morningstar Rating | 3 Stars | 4 Stars |
Now that we have a clear side by side comparison let’s go through each row of the above table.
Issuer: Both iShares and State Street are well respected firms with lots of experience.
Fund Objective: Many high yield bonds issues do not trade very actively or at all. Including these illiquid bonds in an ETF’s portfolio can distort and make the performance of the fund highly volatile. Because of this both funds seek to track bond indexes which give broad exposure to the liquid high yield bond universe. However, while the goal is the same, the funds go about it by tracking different indexes.
Index Tracked: Both fund’s track indexes which are designed to give broad exposure to the liquid high yield bond universe. However the performance of the JNK is more volatile than the performance of the HYG which most likely can be attributed to the higher volatility of the Barclays index vs. the iBoxx index.
Duration: With high yield bonds the large majority of price movements result from credit risk, rather than bond duration or interest rate risk. Because of this the difference in duration will have very little impact on the relative performance of the funds.
Tracking Error: Tracking error is a measure of how closely the ETF tracks its stated benchmark. HYG has a slightly larger tracking error however the tracking error of both the JNK and HYG are not significant enough to be a concern to most investors.
Expense ratio: The expense ratio is the yearly charge by the ETF company in order to cover the expenses of managing the ETFs. The JNK has a slight edge here as well. Learn more about Bond ETF expenses here.
Total Assets: Both are very large ETFs with plenty of assets under management to be broadly diversified.
Average Daily Volume: This is the number of shares that the ETF trades on average per day. Looking at volume is important because it is a sign of how liquid the ETF is and how low the difference between the price where you can sell the ETF and the price where you can buy the ETF will be. This is called the spread and the narrower the spread is the less costly the ETF is to trade. As both ETFs trade millions of shares per day liquidity is not a concern for either of these ETFs.
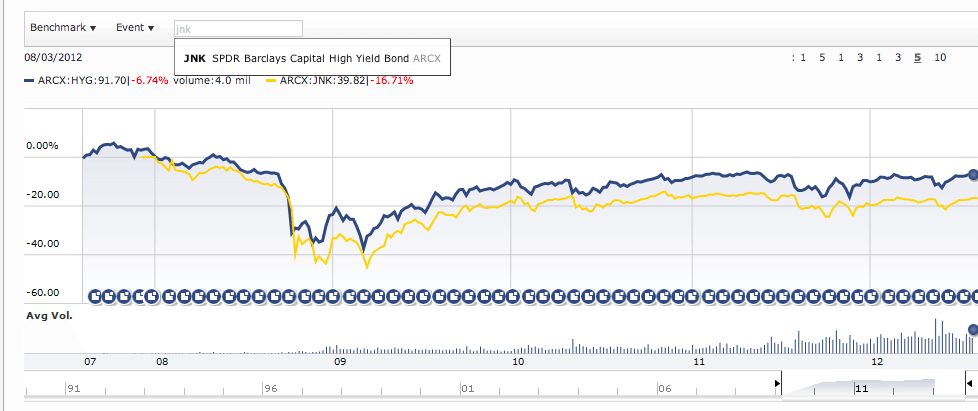
Morningstar Rating: Morningstar is the most well respected rater of mutual funds and has extended its rating system to cover ETFs as well. They have a 5 star system which you can read more about here. With a rating of 4 stars the JNK ETF is seen as superior to the HYG ETF in Morningstar’s eyes. However, as you can see from the chart below, investors would have earned a higher return by investing in the HYG historically, because the JNK’s performance suffered a much larger drawdown than the HYG during the financial crisis. It seems from Morningstar’s ratings however that they feel that the factors that caused this have been reversed to the point where the JNK is the better fund.
Below is a performance chart of the two ETFs over the last 5 years. The blue line is the HYG and the yellow line is the JNK. As discussed above the performance of the HYG has been superior. This holds true over the last 3 years and 1 year periods as well.
HYG vs. JNK
Trusted & Regulated Stock & CFD Brokers
What we like
- 0% Fees on Stocks
- 5000+ Stocks, ETFs and other Markets
- Accepts Paypal Deposits
Min Deposit
$200
Charge per Trade
Zero Commission on real stocks
64 traders signed up today
Visit Now67% of retail investor accounts lose money when trading CFDs with this provider. You should consider whether you can afford to take the high risk of losing your money.
Available Assets
- Total Number of Stocks & Shares5000+
- US Stocks
- German Stocks
- UK Stocks
- European
- ETF Stocks
- IPO
- Funds
- Bonds
- Options
- Futures
- CFDs
- Crypto
Charge per Trade
- FTSE 100 Zero Commission
- NASDAQ Zero Commission
- DAX Zero Commission
- Facebook Zero Commission
- Alphabet Zero Commission
- Tesla Zero Commission
- Apple Zero Commission
- Microsoft Zero Commission
Deposit Method
- Wire Transfer
- Credit Cards
- Bank Account
- Paypall
- Skrill
- Neteller
What we like
- Sign up today and get $5 free
- Fractals Available
- Paypal Available
Min Deposit
$0
Charge per Trade
$1 to $9 PCM
Visit Now
Investing in financial markets carries risk, you have the potential to lose your total investment.
Available Assets
- Total Number of Shares999
- US Stocks
- German Stocks
- UK Stocks
- European Stocks
- EFTs
- IPOs
- Funds
- Bonds
- Options
- Futures
- CFDs
- Crypto
Charge per Trade
- FTSE 100 $1 - $9 per month
- NASDAQ $1 - $9 per month
- DAX $1 - $9 per month
- Facebook $1 - $9 per month
- Alphabet $1 - $9 per month
- Telsa $1 - $9 per month
- Apple $1 - $9 per month
- Microsoft $1 - $9 per month
Deposit Method
- Wire Transfer
- Credit Cards
- Bank Account


