Fibonacci Trading Strategy | A How to Guide 2021
Are you aspiring to become a more sophisticated trader by improving your knowledge of trading strategies? If so, it’s crucial that you have a firm grasp of how technical analysis works. One such method that you might be considering is the Fibonacci trading strategy. The strategy looks to capitalize on market trends, with investors placing a trade to catch a correction before the trend resumes.
In this article, we explain everything you need to know about the strategy. We cover what the Fibonacci trading strategy actually is, how retracements work, what risks you need to consider, how you can set up a trade, and more.
-
-
Trade with eToro - World Leading Social Trading Platform
Our Rating
- Trade Stocks, Forex, Crypto and more
- 0% Commission on Real Stocks
- Copy Trades of Pro Investors
- Easy to Use Trading Platform
67% of retail investor accounts lose money when trading CFDs with this provider. You should consider whether you can afford to take the high risk of losing your money.
[three-steps id=”195428″]Step 1: Open a Trading Account to Apply Your Learnings
To get off the mark you will need to have a trading account to apply the principles of the Fibonacci trading strategy in order to understand the mechanics of the system in action. There are a range of great trading platforms out there, some with demo accounts that allow you to try and test the theory before taking the plunge and trading with real money.
Consider what type of asset you wish to trade, depending on your location, some platforms will be regulated for some asset, while others are not. We have provided a list of some of the best platforms in the US for those looking to trade to Forex, Cryptocurrency or regular stocks, you should pick the relevant platform from the list below.
1. eToro – Best Overall
eToro is probably the most user-friendly online investment account you will come across today. It has an easy to use user interface, a relatively low minimum initial deposit amount of $200 and some of the most interesting trading options. It features not just some of the most innovative trading tools features but also advanced risk management features like the trailing stop lop loss. More importantly, it has the social trading feature that allows for copy trading.
eToro is a multi-asset broker implying that it gives you access to one of the most diverse trading securities, from cryptocurrencies to stocks, forex, and commodities. It also maintains some of the most competitive trading fees in the form of competitive spreads and no commission trades. Their trading platform is proprietary and was recently named the most innovative trading platform in Europe. And all these make the best crypto exchange for advanced digital currency traders.
- Several deposit and withdrawal options including PayPal
- eToro is a highly regulated exchange
- Presents all traders with a free and highly secure crypto wallet
- One may consider their $25 withdrawal fee exorbitant
- No phone support
75% of investors lose money when trading CFDs.2. Cryptorocket – Best multi-asset investment platform
Cryptorocket the multi-asset broker stands out with its highly innovative and interactive user interface, competitive spreads, and straight-through processing approach to trade execution. The online trader is also relatively new and specially designed to address some of the most common challenges affecting the online securities trading industry. The most significant being the ability to trade multiple securities including shares, stocks, and cryptocurrency.
It not only integrates smoothly with the standard MT4 platform but also brings along some MT4 specific trading features like special prebuilt trading tools and advanced risk management features like limit orders and trailing stops. EURUSD spreads average 0.9 pips while the minimum account deposit stands at $10.
Our Rating
- Diversify your portfolio with currency pairs, stocks, and indices
- Features a comprehensive MT4 trading platform
- Same-day withdrawal processing
- Cryptorocket is an unregulated exchange
- Sluggish customer support
3. Stash Invest – Best for personalized stock portfolio
Stash is an investing app that personalizes the art of stock trading and investments by letting you invest in the stocks and industries you value. It considers both your financial information and values in creating a highly personalized investment portfolio for you. You then link it with your checking account – its primary funding option. And there are no minimum account operating balances required.
The Stash app doesn’t manage your investments, rather, it simplifies the investment process by providing you with as much information about trade and investing as possible. It is specially designed to help make stock investments approachable for beginners. And they are affordable, running three subscription accounts that include $1/month for Stash Beginner, $3/month for Stash Growth, and $9/month for Stash+.
OUR RATING
- Exposes you to over 400 stocks to choose from
- Low minimum investment
- Helps you create personalized investment portfolio
- No active investment portfolio management
- Their monthly fee may be higher than most robo-advisors
Step 2: Learn How the Fibonacci Trading Strategy Works
What is the Fibonacci Trading Strategy?
The main concept of the Fibonacci trading system is to exploit deviations from the general trend by purchasing the asset when publically available information causes the price to distort and then require a market correction .
For example, let’s say the price of Apple stocks is on a continued upward trend, subsequently increasing by more than 10% in less than a week.
This has been put down to Apple’s recent announcement that global sales are at record heights. However, the price of Apple cannot continue to increase indefinitely, so you are expecting a market correction at any given time.
Market Correction? A market correction is when a trend temporarily reverses in direction. This is usually because those with open positions decide to cash out their profits, which results in the price of the asset going down.Although Apple has gone down by 3% in the past 24 hours, you expect this correction to be short-lived. As such, by following the Fibonacci trading strategy, you purchase Apple stocks at a discounted price.
Your calculations were correct, as Apple stocks resumed its upward trend by a further 10% over the course of next month. The key metric that allows you to identify when to enter the market is the Fibonacci level indicator that you will find on most trading platforms.
What are the Pros and Cons of the Fibonacci Trading Strategy?
The Pros
- Profit from the financial markets regardless of which direction the trend is going
- Can be used to open new positions and exit current orders
- Reduce your risks by installing stop-loss orders
- Suitable for any asset class
- Learning the Fibonacci trading strategy will allow you to learn other systems along the way
- Once you have identified an opportunity, allow market orders to automate the process
The Cons
- Can be costly if you make a mistake without installing risk-averse stop-loss orders
- Identifying a market correction is not easy, so you’ll need to master your trade
What are Retracements?
As we briefly noted earlier, retracements are pricing corrections that occur during a market trend.
This trend could be an upward movement where markets are bullish or a downward trend during a bear market. For example, let’s say that the price of gold has been on the rise for four days straight. Those that are holding positions in gold will at some point decide to cash out their gains.
In doing so, this might temporarily encourage other traders to do the same thing, as they fear the markets might be about to reverse. This has a direct impact on the price of the asset, as when more sellers enter the market, the price will go down.
However, as the downward movement is only temporary, it has no reflection on the direction of the wider trend. This means that the upward trend of gold will continue once the initial sell-off has concluded. If you were to use the Fibonacci trading strategy effectively, you would be able to buy the asset at the bottom of the retracement.
Discounted Asset? By purchasing an asset during the retracement phase, you are effectively buying it at a discount before the larger trend resumes. Those that are able to time the market to perfection will benefit the most.What are Fibonacci Levels?
The Fibonacci sequence was created by an Italian mathematician in the 12th century. Each number within the sequence is the sum of the previous two.
For example, the first 10 numbers within the Fibonacci sequence are 0, 1, 1, 2, 3, 5, 8, 13, 21, and 34. This is highly relevant to the discussion of Fibonacci levels, as the sequence sits at the heart of the Fibonacci trading strategy.
When traders identify a market trend, they will then assess the Fibonacci levels by using a charting indicator.
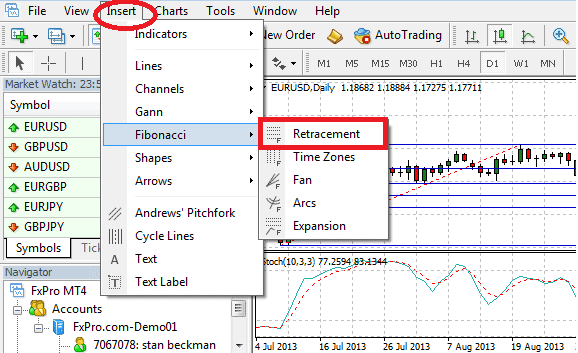
This is with the view of predicting the future movement of the asset. Most trading platforms allow you to utilize the Fibonacci levels indicator. You simply need to drag the tool from the entry point of the trend, up to the current market position of the asset.
Step 3. Learn how to apply the Fibonacci Trading System?
We have outlined the typical step-by-step process of how an investor might use the Fibonacci trading strategy.
1: Identify a trend
First and foremost, you will need to identify a market trend. One of the biggest advantages of the Fibonacci system is that you can use it on any asset class. This gives you thousands of markets to choose from. Whether it’s stocks and shares, commodities, cryptocurrencies, futures, options, or indices – the Fibonacci trading strategy can be used if a prolonged trend can be identified.
The trend can be moving in any direction, meaning that you also stand the chance of making gains if the asset is in a bear market.
2: Understand your strategy
Before you get to the point of setting up market orders, you need to ensure you understand what it is you are looking to achieve. If you have identified an upward trend, you are looking to purchase the asset when it enters a retracement period. This means that you will be looking to ‘long’ the asset at a ‘lower’ price.
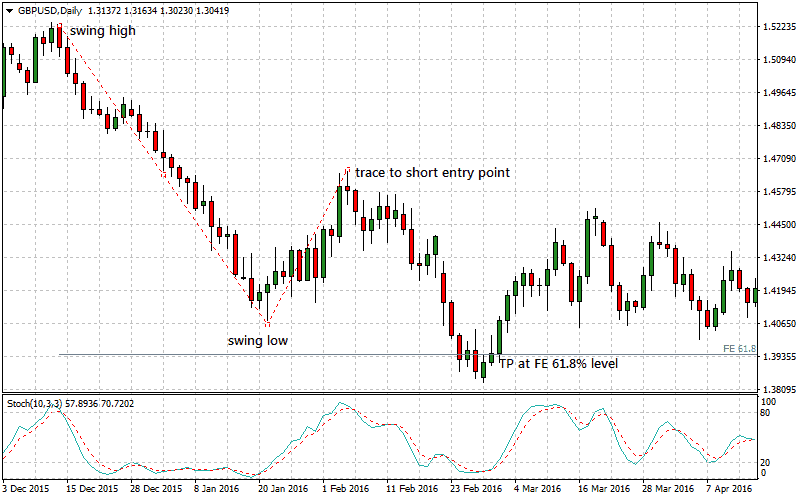
Similarly, if you are looking to profit from a downward trend, then you’ll be ‘shorting’ the asset when the retracement occurs. You’ll be looking to short the asset at a ‘higher’ price before it continues its downward trend.
Note: A ‘bear’ market is when there are more sellers than buyers. If there are more buyers than sellers, then it’s a ‘bull’ market. These two terms are used extensively in the financial markets.3: Use the Fibonacci level indicator
So now that you have identified the market that you are looking to target, you now need to assess your ‘entry point’. This is the point at which you will be entering the market. For example, if you’re targeting an upward trend on IBM stocks, then you’ll need to assess the price at which you are looking to go long via a market order. To do this, you will need to use the Fibonacci level indicator, which you’ll find at most trading platforms.
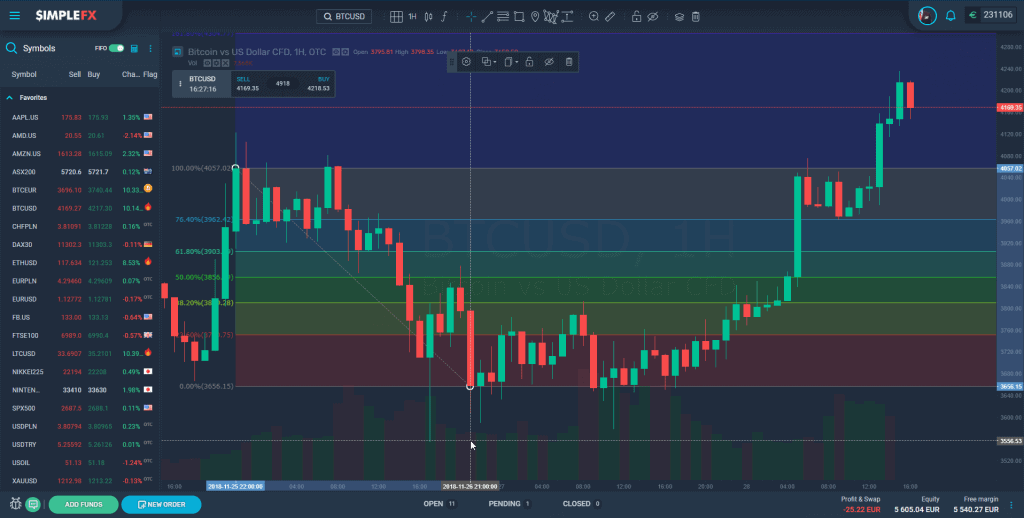
The Fibonacci level indicator allows you to drag open a box on the main trading screen. As such, you’ll need to identify the ‘swing low’ and ‘swing high’ levels. The swing low relates to the very bottom of the market trend. The swing high refers to the highest point of the trend. This is the area of the chart that your Fibonacci level indicator needs to reflect.
4: Assess the Fibonacci levels
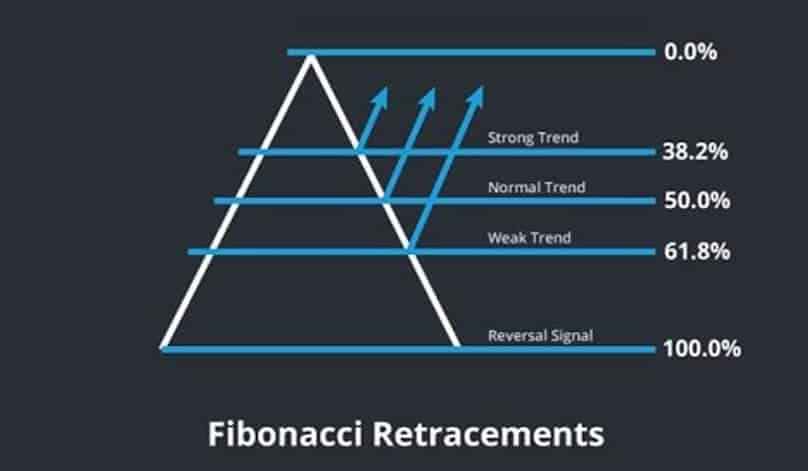
Once you have drawn your Fibonacci indicator from the swing low to the swing high, you will then be presented with the Fibonacci levels. These are percentage indicators, based on the Fibonacci sequence that we discussed earlier. This is where things become quite complex. There is no hard and fast rule as to which percentage ratio you should place your order. This is because the future direction of the asset is driven by market forces, meaning there is no way to predict this with any certainty.
However, some key Fibonacci ratios that experienced traders like to work from are 23.6%, 38.2%, and 61.8%. For example, let’s say that you decided to place your buy order at the 38.2% mark. You would need to see what entry point the Fibonacci indicator suggests, based on the 38.2% level.
5: Placing your entry order
Now that you have identified a target entry point via the Fibonacci indicator, you now need to place a market order. Before you do, you should wait to receive confirmation from the markets that the retracement is in fact temporary, and not a longer-term reversal.
This will ensure that you do not base your trade purely on Fibonacci retracement levels. Once you feel confident that the Fibonacci indicator has identified a good entry point, you now need to place a market order. This is where you enter the amount that you wish to invest in the asset, and at what price.
6: Placing your exit order
It is also important that you assess your profit goals when using a Fibonacci trading strategy. This is known as an ‘exit order’. In the same way that you used the Fibonacci level indicator to ascertain your entry point, you can use the same tool to estimate the point at which you should cash out. Anything that resembles a profit from the current retracement level will be a ratio of 100% of more.
For example, key Fibonacci levels used by traders are 161.8%, 261.8%, and 423.6%. Once you have chosen which ratio you are looking to target, the Fibonacci tool will tell you which price you need to set your exit trade at.
Risks of the Fibonacci System?
As is the case with any trading strategy, there is no guarantee that you will be successful when utilizing the Fibonacci system.
- Incorrectly Identified a Trend
One of the biggest mistakes that newbie traders make is that they incorrectly identify a trend. If this is the case, then the Fibonacci tool will be of little use. You should be especially careful not to choose trends that have yet to experience a tempory retracement.
- Incorrect Entry Point
Even if you have correctly identified a suitable trend to target, you still need to get your entry point right. As we briefly discussed earlier, 23.6%, 38.2%, and 61.8% are the most common entry points used by traders. However, what works for some traders might not necessarily work for you.
- Low Liquidity
If you are trading major marketplaces such as the S&P 500, forex, or commodities like gold and oil – you will never have any issues with liquidity. However, if you choose to implement your Fibonacci trading strategy on a single stock (like IBM, Facebook, etc.), then you need to ensure that there are sufficient levels of liquidity. If there isn’t, then the Fibonacci system will not work, as volatility will be much greater.
- Fundamental News
There are two main analysis methods used in the financial markets. The first is technical analysis, which is the process of studying historical chart patterns. The Fibonacci trading strategy falls within this bracket. The second method is known as ‘fundamental analysis’.
This is based on real-world news events that have a direct impact on the value of an asset. For example, if there is a shortage of oil supplies due to uncertainties in the Middle East, then the price of oil will go up. As the Fibonacci trading strategy bases its formula on the chart, a fundamental news event would leave its projection redundant.
How to Mitigate the Risks of the Fibonacci Trading Strategy?
Although the Fibonacci trading strategy is fraught with risks – especially if you are still a newbie day trader, there is one tool in particular that you can use to mitigate these risks – stop-loss orders.
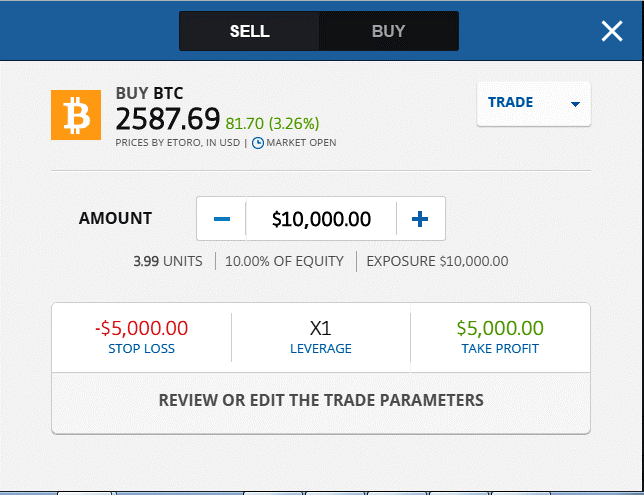
For those unaware, a stop-loss order is a way to exit a trade automatically when the markets go against you. You get to choose the price point that you wish the stop-loss order to execute. This allows you to limit your losses when a Fibonacci trading strategy doesn’t go to plan.
Once again, you need to evaluate the exact point at which your order should be triggered. The best way to do this in an upward trend is to place your stop loss just below the retracement level.
For example, if opting for the 38.2% ratio, then place your stop loss just below the suggested entry point. In doing so, your losses will be minimal in the event that your analysis was incorrect. If you are trading a downward trend, then the stop loss should be placed just above the retracement level.
Step 4. Open an Account to Apply the Strategy
Here is the step by step process of on how to open a cryptocurrency trading account with eToro:
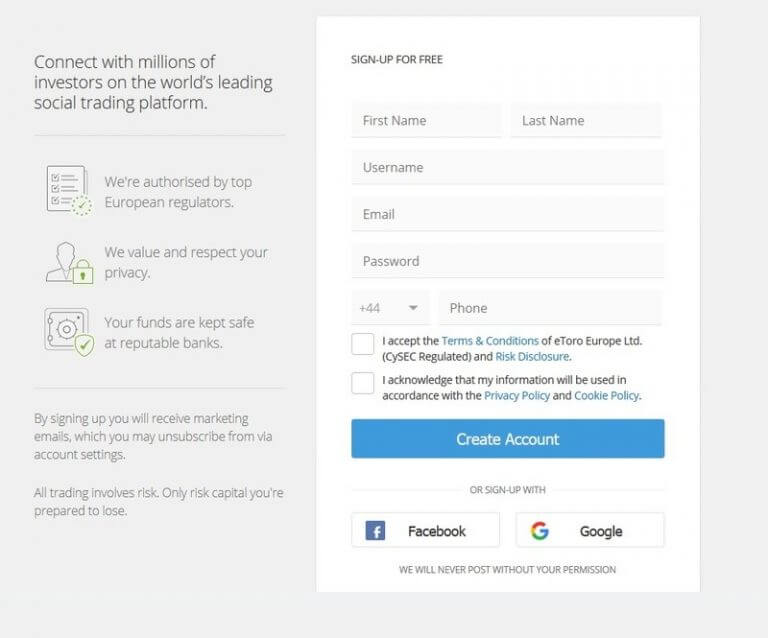
Step 1: Hit the join button on the eToro home page and proceed to complete the user profile. The page captures such personal details as your name, address, email and phone.
Step 2: Answer the questions provided by eToro. These helps the broker test your trading skills and experience
Step 3: Next, you will furnish eToro with a copy of your ID and proof of identity. This is a requirement for all brokers operating in the United States
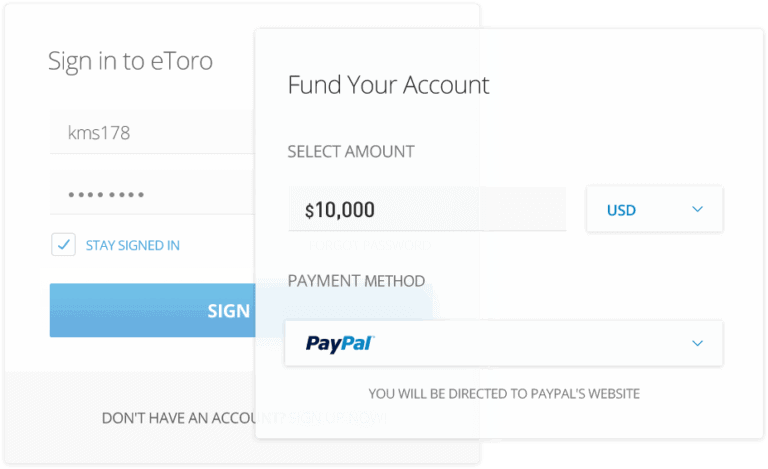
Step 4: Fund your account. You can fund your eToro account with at least $200 via PayPal, debit card or bank wire transfers for free
Step 5: Start trading cryptocurrencies
Summary
In summary, the Fibonacci trading strategy can be a highly useful tool to employ if utilized correctly.
The strategy allows you to benefit from a larger upward or downward trend, at a discounted price. However, as is the case with any trading system, you need to have a firm grasp of the strategy prior to risking your own money.
This is why we would suggest mastering the strategy with a demo account first.
The most important takeaway from our guide is that you should implement the risk management strategy that we have suggested. At the forefront of this is installing a stop-loss order to protect you from an incorrect projection.
You can place this just below the retracement level in an upward trend, and just above it if trading a downward trend.
Trade with eToro - World Leading Social Trading Platform
Our Rating
- Trade Stocks, Forex, Crypto and more
- 0% Commission on Real Stocks
- Copy Trades of Pro Investors
- Easy to Use Trading Platform
67% of retail investor accounts lose money when trading CFDs with this provider. You should consider whether you can afford to take the high risk of losing your money.FAQs
How do you calculate Fibonacci?
Calculating the Fibonacci ratio is a highly complex task that requires advanced skills in mathematics. Fortunately for you, the Fibonacci retracement tool will perform the calculation automatically.
How do I reduce the risks of a Fibonacci trading system?
The most important safeguard that you can install is that of a stop-loss order. This should be placed just above or below the Fibonacci retracement level, depending on whether you are trading an upward or downward trend.
What markets can I trade my Fibonacci system?
You can trade your Fibonacci system on virtually any marketplace. This includes stocks and shares, indices, cryptocurrencies, futures, options, and more. Just make sure that it is a market with sufficient levels of liquidity.
Is the Fibonacci system always accurate?
There is never any guarantee that your Fibonacci projections will come to fruition. This is why you should wait for the markets to confirm the trend prior to placing your trade.
Do all sites allow you to use the Fibonacci retracement tool?
Most trading platforms support the Fibonacci retracement tool. However, if you’re using a super-basic platform that is designed for newbies, then it might not come with any technical indicators at all.
What is the most commonly traded Fibonacci retracement level?
Seasoned traders commonly base their projections on the 23.6%, 38.2%, and 61.8% retracement levels.
See our wider range of trading resources
Kane Pepi
Kane holds academic qualifications in the finance and financial investigation fields. With a passion for all-things finance, he currently writes for a number of online publications.


