How to Buy Netflix Stock for Beginners 2026
Netflix is the dominant player in the ever-growing content streaming industry.
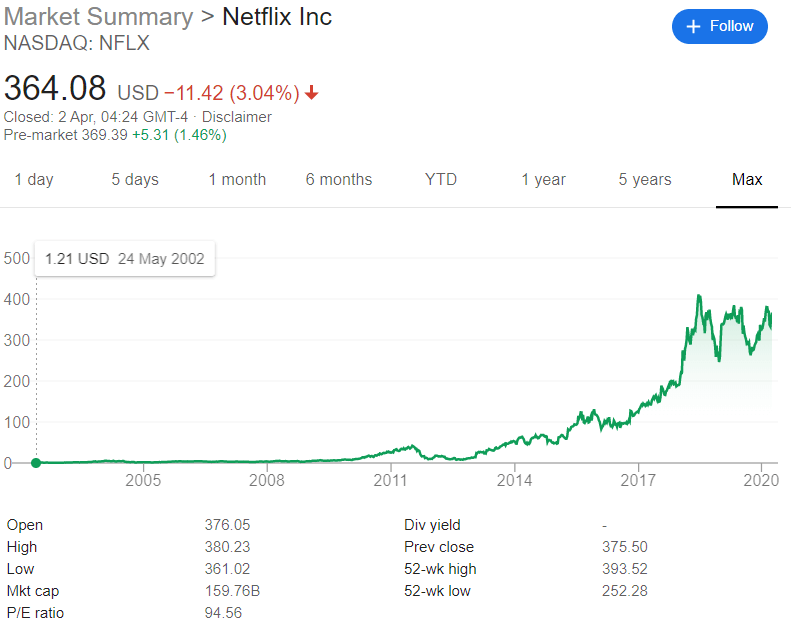
The media company launched in 1997 and went public in 2002. Today, Netflix is a multi-billion dollar entity with a global presence. And if had you purchased $1,000 worth of shares when Netflix was first listed on the NASDAQ, your investment would now be worth over $25,000.
If you’re looking to get your hands on Netflix stock today, we cover the basics of the stock and the best stock brokers in the market.
-
-
Where to Buy Netflix Stock
You will need to use an online stock trading site to buy or sell Netflix stocks. And with hundreds of stockbrokers now active in the market, identifying the best brokerage can be quite confusing. To help you get started, we have listed our top two stockbroker picks of 2026. Each broker is heavily regulated, supports multiple payment methods, and provides an account registration process that takes just minutes.
RECOMMENDED BROKER

Rating
What we like
- 0% Commission
- Trade Stocks Via CFDs
- Authorized & regulated by the FCA
Min Deposit
$100
Charge per Trade
Zero Commission
Available Assets
- Total Number of Stocks & Shares+2000
- US Stocks
- German Stocks
- UK Stocks
- European
- ETF Stocks
- IPO
- Funds
- Bonds
- Options
- Future
- CFDs
- Crypto
Charge per Trade
- FTSE 100 Zero Commission
- NASDAQ Zero Commission
- Dax Zero Commission
- Facebook Zero Commission
- Alphabet Zero Commission
- Tesla Zero Commission
- Apple Zero Commission
- Microsoft Zero Commission
Deposit Method
- Wire transfer
- Credit Cards
- Bank Account
- Paypal
- Skrill
Detailed provider overview
1. Plus500 – Trade Stocks though CFDs
Plus500 is our top Netflix stock provider. The online CFD broker has an excellent reputation in the online trading space, and its parent company is listed on the London Stock Exchange.
Plus500 is also heavily regulated, with licenses with ASIC and the FCA. Although Plus500 is UK-based, it accepts traders from most countries. Plus500 does not charge any trading commissions, and takes its payments through the spread of the buy/ sell price. This starts at 1.9 pips on major forex pairs, and more when trading blue-chip stocks like Netflix.
You will be able to open an account by depositing just $100, which can be done via Paypal, a bank transfer, or a debit/credit card. You won't be charged any deposit or withdrawal fees, which is an added bonus. If you opt for the CFD route, Plus500 allows you to apply leverage to your trade. You can also short-sell Netflix stocks if you think that the price will go down.
Our Rating
- Fast order execution
- No commissions
- Tight spreads
- Stocks only available via CFDs
- Its educational resources are sparse
80.5% of retail CFD accounts lose money. Sponsored ad2. Stash Invest – Best USA Broker With Low Deposits
If you don't have any online stock trading experience, we would encourage you to check out Stash Invest. The US-based broker offers a super user-friendly trading platform, and you get started with a minimum deposit of just $5. Stash Invest is also notable as it supports fractional shares.
Stash Invest does not support debit/credit cards or e-wallet deposits, so the only way you can fund your account is by linking it to your US checking account.
Unlike Plus500, you will need to pay a monthly fee to use Stash Invest. With that said, this starts at just $1 per month, rising to $9 for those of you that require the complete suite of services offered by Stash. Finally, the online broker is a suitable option if you're looking to diversify into other US stocks.
Our Rating
- $5 minimum deposit
- Allows fractional stock purchases
- Monthly fee from just $1
- Limited number of shares hosted
- No access to international stock exchanges
Sponsored adHow to Buy Netflix Stock
Looking to buy Netflix stock right now? Below we have highlighted the step-by-step guide that you can follow when purchasing Netflix shares via a broker.
Note: As is the case with all regulated stock trading sites, you will first need to open an account and verify your identity. You’ll also need to deposit some funds.Step 1: Search for Netflix (NFLX) Stock
Brokerages offer a highly extensive library of US and international stocks, so you will need to navigate your way through the site to find Netflix.
Enter ‘NETFLIX’ into the search box at the top of the screen and click on the corresponding result.
Step 2: Click on ‘Trade’
You will now be shown some market statistics about Netflix. To proceed with your purchase, click on the ‘Trade’ button.
Step 3: Set-Up Order and Buy Netflix Stock
On the pop up buy/sell window that appears enter the trade specifications.
These include:
- Amount: The ‘amount’ box simply refers to the amount of Netflix stocks that you wish to buy in dollars and cents. This is NOT the number of individual shares that you wish to buy. As such, if you want to invest $250, enter this into the box.
- Set Rate: This refers to the price that you wish your Netflix order to be executed at. If you’re just starting out, it’s best to leave this as a market order, meaning you’ll take the next available price. If you want your order executed at a specific price, then opt for a limit order and type in your preferred entry point.
- Stop Loss: Although stop-loss orders are not compulsory, you are best advised to install one. This will ensure that your trade is automatically closed when the markets go against you. Enter the price that you wish to close a losing trade.
- Take Profit: Again, take-profit orders are not compulsory, but it will allow you to lock in your gains when a specified price point is hit. This ensures that you do not need to be sat at your computer to exit a trade.
Finally, click on ‘Buy’ to complete your order.
Why Do People Invest in Netflix?
Huge Upside Potential
Netflix stocks have grown exponentially since its public listing in 2002. Although the demand for content streaming is still minute in comparison to traditional TV and cable services, the gap is narrowing year-on-year.
Subscription Numbers Continue to Grow
Netflix is still the dominant player in the online content streaming space, which is evident in the firm’s ever-growing subscription numbers. This now stands at a whopping 167 million subscribers globally, with the provider expected to add a further 7 million in the first quarter of 2020.
Greater Focus on Original Content
Although Netflix first launched in 1997, it wasn’t until 2010 that the streaming provider released its first original film. Fast forward to 2020, and its original content offering of TV shows, documentaries, and movies stands at 40% of its entire library.
About Netflix Stock
Company and Stock history
Netflix was founded in 1997 by Reed Hastings and Marc Randolph. Netflix started out as a postal DVD rental company. Users could choose which movies they wanted to hire, and then Netflix would post the DVD straight to the customer’s door. Quickly recognizing that the movie rental sector was slowly but surely falling into decline, Hastings and Randolph launched its digital streaming service.
Five years later, the company went public and listed on the NASDAQ exchange. At the time, the Netflix stock was valued at $15 per share. The very same shares hit an all-time high of $411 in mid-2018, representing a 2,600% increase from its initial IPO price.
The vast majority of Netflix’s business model centers around its subscription service. In order to retain customers and attack new subscribers, the company has increased its focus on original content. Popular TV series on the platform include Stranger Things, Orange Is the New Black, and the House of Cards. Netflix is also involved in cutting-edge documentaries, with Making a Murderer proving hugely popular with its subscriber base.

Netflix Stock
Netflix reached its all-time high of $411 back in July 2018. Since then, its share price has been somewhat turbulent. For example, during the short-term bear market of Q4 2018, Netflix stocks lost close to 40% in value. The shares have since recovered and closed Q3 2019 at $375.
Netflix is operating in a content streaming marketplace that is slowly becoming oversaturated. When you consider the sheer size of its main sector rivals – Apple, Amazon, and Disney, Netflix’s market share is under significant threat.
For example, Disney+, which offers a huge library of original content, costs just $6.99 per month for US consumers. When you consider that the Disney+ service only launched in November 2019, its impressive that the platform has already attracted a domestic subscription base that’s close to half of Netflix’s subscriber base.
Conclusion
Netflix is not only operating in an ever-growing content streaming sector, but it holds the lion share of the industry. This is evident when you consider Netflix’s 167 million global subscription base.
Buying the Netflix stock also carries its fair share of risks. At the forefront of this is fierce market competition from the likes of Amazon, Apple, and Disney. While Netflix is still in negative cash flow territory, its rivals have exceptional strong balance sheets.
Glossary of Stocks Terms
StockA stock is a representation of a company’s equity. When a company wants to raise capital, it issues stocks to the public. It is the aggregation of the total stocks owned by one individual that inform their shareholding of the company.
SharesA share is an indivisible unit of capital that expresses the ownership relationship between a shareholder and a particular company, mutual fund, REITs or limited partnership. A share indicates a portion of ownership (claim) that one has on a company or fund.
DividendDividend refers to the portion of the company’s profits that is distributed to its stockholders. It can be on a quarterly or annual basis.
Bull marketA bull market is an economic condition where the stock markets are in an extended period of consistent increase in stock prices.
Bear MarketA stock market is said to be bearish if it is involved in extended periods of continuous price decrease of the stock prices.
Stock ExchangeA stock exchange is an institution or a platform where shares and stocks and a host of other money market instruments are traded.
Return On Investment (ROI)The return on investment is the profit you make from trading in or investing in shares and stocks of a particular company. It often comes from selling the investment at a higher price than was originally bought or benefiting from dividends and other profit-sharing schemes as a result of owning and holding onto a particular investment.
BrokerA broker may be a person or entity that engages in the buying and selling of different types of investments on behalf of other individuals or entities at a fee (or commission).
Day TradingDay Trading is the practice of buying a money market investment product and selling it as soon it reports price increase or loss, within the same day. Traders engaged in day trading are referred to as “day traders” or “active traders”
ArbitrageArbitrage is the act of buying and selling security at different stock exchanges or markets with varying prices. If, for instance, stock ABC sells at $11 on one exchange and $11.75 on the other, arbitraging involves buying from at the low price exchange and profiting by selling it at the higher-priced exchange.
IndexA stock index is a statistical measure of the change in the stock and securities market. It comprises a hypothetical portfolio of different companies whose change in prices is calculated to determine market performance.
Initial Public Offering (IPO)The Initial Public Offering refers to the sale of company stock to the public for the first time. It is the act of taking a company public and is highly regulated by such financial regulators like the SEC in the USA and FCA in the UK.
OptionsOptions are derivative financial instruments whose price is based on the value of their underlying tradable security like shares and stocks. They are contracts that give the holder an option to buy or sell the underlying asset at a later date. Unlike futures, an options contract holder has the choice to buy/sell or not.
Call optionsThis is an options contract that gives the holder an option to buy the underlying asset before the expiry date.
Sell optionsThis option gives its holder the choice of selling the underlying asset before its expiry date
Mutual FundsA mutual fund refers to a company that pools funds from different investors and invests these funds in stocks, bonds, and other financial market securities. They then distribute the capital gains from these invests to their members.
Over-the-CounterThe process through which stocks for companies that are not listed with accredited stock exchanges like the NYSE are traded. It is a broker-dealer network for unlisted stocks for companies that do not meet listing requirements set by the organized exchanges.
OverboughtA stock is said to be overbought if it is traded excessively over a short period of time and at unjustifiably high prices.
OversoldA stock is said to be oversold if it is consistently traded below its true value.
Ask PriceAlso referred to as the offer or asking price, this refers to the lowest price that the seller will take for a stock.
Bid PriceBid price refers to the maximum price that a buyer is willing to pay for a stock.
VolumeIn the stock trading context, Volume refers to the number of shares that change hands within a given period of time, be it a day, month or annually. It is trading/investment indicator where rising trade volumes point to a healthy stock while dwindling volumes are indicators of investor pessimism towards a stock.
VolatilityRefers to the statistical measure of the change in price of a stock over a given period of time. It is a measure of the rate and the time it takes for a stock price to move from high to low and how long it remains within a certain price range. The higher the volatility, the higher the risk.
52-Week HighThis refers to the highest closing price recorded by a given stock in the last 52 weeks.
52-Week LowThis refers to the lowest closing price that a particular stock recorded in the last 52 weeks.
Bid-Ask SpreadThe bid-ask spread refers to the difference between the lowest price that a seller is willing to take for their stock and the highest price that a buyer is willing pay for the stock. It is the difference between the quoted ask and bid prices.
Market OrderA market order is an instruction by an investor to the broker or brokerage platform asking them to buy/sell a stock or any other security at the best price available at that moment. It is often issued when an investor wishes to enter or exit the market quickly and at the prevailing rates.
Limit OrderA limit order is an order that triggers a sale or buy when a predetermined or better price is met. For a buy limit order, the buy order is executed once the set limit price or a better price is triggered. The sell limit order on the hand triggers the sale of stocks if the limit price or better price is hit.
Stop OrderAlso referred to as a stop loss order, it is an order that triggers a buy or sell action once a predetermined price level is hit. It is designed to help you minimize possible loss on a given trade should the markets move against your bet.
Take ProfitTake profit is a type of limit order dictating the price level at which the broker or brokerage platform is to close a trade for profit.
Capital GainsCapital gain refers to the value rise of a tradable financial instrument that makes its selling price higher than the buying price. It can also be referred to as the profit realized from liquidating a capital investment like stocks.
ETFsAn ETF is a collection of many tradable instruments like bonds, stocks, and commodities. These are listed on the exchanges and traded like ordinary stocks.
Debt-to-Equity RatioThe debt-to-equity (D/E) ratio is a financial ration tool used to measure the financial health of a company by gauging value of its equity in relation to debt. It is achieved by dividing the company’s total liabilities in relation to its shareholder’s equity.
Dividend InvestingThis is an investment strategy where the investor only buy shares that have consistently paid out high dividends in the past or others with the fastest dividend rates. Dividend investing strategy advocates are more interested in how much a shares pays in dividends than its price fluctuations.
Growth StocksGrowth stocks refers to the stocks of companies that are expected to grow at a faster rate than the industry average and report consistent and sustainable cashflows. The company sales and revenues are also expected to increase at a faster than that of an average company in the same industry.
Penny StocksThese are also referred to as micro-cap or nano-cap stocks and refers to the stocks of relatively small companies valued less than $5 and only trade via the Over-The-Counter markets.
Blue ChipA blue chip refers to a nationally recognized and financially sound company with a long and stable record of consistent growth. It is company whose financial might and nature of operation make it well suited to face turmoil and remain profitable in the uncertain economic conditions..
Short SellingShort selling is a trade/investment strategy where the investor is banking on the decline of the shares of a particular company. They therefore borrows these shares, sells them at the current market price and buys them back after they lose value, effectively profiting from the price difference.
YieldYield refers to the profit/earnings generated from investing in a particular stock or market instrument over a given period of time and is expressed a percentage of the stock’s market value, face value or as percentage of invested amounts.
Capital StockCapital stock, also referred to outstanding shares, refers to all the regular shares issued by a company and held by all its shareholders including the restricted/locked-in shares held by company insiders, executives, and institutional investors. The number of capital stock is used in calculating key metrics including cash-flow per-share and earnings per share.
Earnings Per Share (EPS)EPS refers to the monetary value, the profit or earnings attributable to each outstanding shares held by a company. It is a financial ratio that is arrived at by dividing the company’s profit by its outstanding shares of the common stock.
Price Earning Ratio (PER)Also referred to as Price-to-earnings ratio, PER is a financial metrics tools used to check if a company’s shares are over/undervalued by dividing the shares current market price with its earnings-per-share.
FloatA company’s flat refers to the number of regular shares issued to investors that are available for trading. The float shares figure is arrived at by subtracting the locked-in shares held by company insiders and executives from its capital stock.
Gap-up StocksGap up stocks refer to company stocks that open the day trading at relatively higher prices than their previous day’s closing price. This is often attributed to the after-market trading activity.
Gap-Down StocksGap down stocks refers to company stocks that open the day trading at relatively lower prices that the previous day’s closing price. For instance if a company stock closes the day trading at $50 but opens the following day trading at $45, it is said to have a 5-point gap down.
Stock BuybackStock buyback, also referred to as share repurchase, occurs when a publicly listed corporation uses a part of its revenues to buy back its shares from the marketplace. The move effectively reduces the number of company shares in circulation, which translates to an increased share price.
HOLDHOLD is a financial recommendation issued by a qualified financial institutions or financial analyst advising investors/traders not to buy or sell a particular stock. It is a no-action situation where long position traders are advised not to sell and others investors advised not to buy into the stock.
Resistance LevelsThis refers to the upper-most price level that a particular stock or any other security reaches but doesn’t exceed due to dwindling number of buyers and an increasing number of sellers.
MacroeconomicIs a branch of economics that’s concerned with the study of how the economy and different large-scale markets are structured, how they behave, and how they perform.
RSIRelative Strength Index is a technical momentum indicator used in market analysis to determine if a stock is overbought or oversold by measuring the magnitude of a recent bullish or bearish price run. It has a scale of 0-100 where RSI readings of 70+ indicate a stock is overbought while an RSI reading below 30 is an indicator of an oversold security.
Moving AverageMoving Averages is a statistical calculation that is specially designed to identify the arithmetic mean of a given number of data sets or range of prices calculated over a given period of time. Each of these data set or price range is created by the average/mean price for that subset. For instance, a single data point on a moving averages scale may represent the average stock price for a day or trading session.
Bollinger BandsBollinger Bands are a technical indicator tool characterized by two statistical carts that run alongside each other indicating the changes in prices and volatility of a financial instrument like stock or commodity over a given period of time.
Fibonacci RetracementsFibonacci retracements refer to two horizontal lines that use the Fibonacci numbers to measure the percentage of price retracement in a bid to indicate where the resistance and support are most likely to occur.
FAQ
How much were Netflix stocks originally?
When Netflix took the company public in 2002, shares were priced at just $15. These very same shares were worth $411 in July 2018, which is when Netflix stock last hit its all-time high.
How much cash does Netflix have?
Netflix is currently in negative cash reserve territory. This peaked at $3.3 billion in 2019, with the company hoping to get this down to $2.5 billion in 2020.
Does Netflix pay dividends?
Netflix is still not in a strong enough position to distribute dividends. As such, you will only be able to make money through capital gains.
Do I need to buy whole Netflix shares?
This depends on the broker that you sign up with. While some force you to buy whole shares (and even minimum lots of 100 shares), others allow you to buy fractional shares.
What stock exchange are Netflix stocks listed on?
Netflix is listed on the NASDAQ, which is the second-largest stock exchange in the US.
How many subscribers does Netflix have?
As per its most recent report, Netflix has 167 million subscribers. It aims to increase this by a further 7 million in the first quarter of 2020.

Kane Pepi
Kane Pepi
View all posts by Kane PepiKane holds academic qualifications in the finance and financial investigation fields. With a passion for all-things finance, he currently writes for a number of online publications.
WARNING: The content on this site should not be considered investment advice. Investing is speculative. When investing your capital is at risk. This site is not intended for use in jurisdictions in which the trading or investments described are prohibited and should only be used by such persons and in such ways as are legally permitted. Your investment may not qualify for investor protection in your country or state of residence, so please conduct your own due diligence. Contracts for Difference (“CFDs”) are leveraged products and carry a significant risk of loss to your capital. Please ensure you fully understand the risks and seek independent advice. This website is free for you to use but we may receive commission from the companies we feature on this site.
Copyright © 2026 | Learnbonds.com