How to Buy McDonald’s Stock
McDonald’s is arguably the largest fast-food chain in the world and currently has 37,000+ restaurants spread in more than 100 countries around the world. Naturally, this makes the NYSE-listed stock one of the largest companies in the US.
McDonald stocks were issued to the public in 1980 and were originally priced at just $1 each. If you bought 100 shares at the time for $100, your investment would be worth more $21,000+ today.
If you’re looking to get your hands on some MCD stock, be sure to read our beginner’s guide. We go over the basics of how you buy McDonald’s stock today, and we also show you the best two trading platforms.
-
-
Where to Buy McDonald’s Stock
As is the case with most blue-chip stocks listed on the NYSE, there are numerous stock trading brokerages that allow you to invest in McDonald’s. To help you get started, we have highlighted our top two picks, detailing such factors as supported payment methods, trading, and non-trading fees:
Detailed provider overview
1. Plus500 – Trade McDonald's Stock through CFDs
Plus500 is a great option that is well worth considering buying McDonald's stock CFD. The UK-based platform is also heavily regulated and licensed by ASIC, CySEC, and the FCA. Its parent company, GAIN Capital, is also listed on the London Stock Exchange. Here, however, you won't be buying actual McDonald's stock but will instead be investing in CFDs.
This means that you won't own the underlying asset and, therefore, won't be entitled to dividends. Nevertheless, CFDs come with a range of other benefits such as giving you the option of applying leverage. CFDs also allow you to short-sell your McDonald's stock implying that you can profit even when the value of its shares go down. Plus500 allows you to add funds via a debit/credit, Paypal, or bank account and minimum deposits start at $100.
There are no fees to deposit or withdraw funds from Plus500. The only trading fee that you will be charged is the spread, as there are no commissions. Plus500 is also a notable option if you are planning to expand your investment portfolio as it lists a wide range of domestic and international stocks, energies, natural gas, commodities, and even cryptocurrencies.
Plus, Plus500 offers a native mobile app on iOS and Android.
Our Rating

- Fast order execution
- No trade commissions
- Tight spreads
- Stocks only available via CFDs
- Its educational resources are sparse
80.5% of retail CFD accounts lose money. Sponsored ad.2. Stash Invest – Best USA Broker With Low Deposits
If you're based in the US and you're looking for an online broker that allows you to buy and sell shares on the move, look no further than Stash Invest. The US-based broker has tailored its services to best serve beginner traders. You, therefore, don't need to have any prior experience to invest in McDonald's stock. The platform also allows you to deposit as little as $5 to get started, which is much less than the other two brokers we have discussed above.
What we also like about Stash Invest is that you will have the option of buying fractional McDonald's stock. This means that you can invest just a few dollars, and diversify the rest of your portfolio into other equities. The online stock trading platform, however, doesn't allow you to add funds with a debit/credit card or e-wallet. Instead, you will need to link the platform with your US checking account.
You will also need to pay a monthly fee to use Stash. This starts at just $1 per month for teh standard investment account. If you want more features - such as a fully-fledged debit card and access to an investment coach, you will need a professional account that has a $9 monthly charge. Although Stash Invest gives you access to the NYSE and NASDAQ, it is yet to incorporate international stock markets like the FTSE.
Our Rating
- $5 minimum deposit
- Allows fractional stock purchases
- Monthly fee from just $1
- Limited number of shares hosted
- No access to international stock exchanges
Sponsored ad.How to Buy McDonald’s Stock
Here is a step by step guide on how to buy McDonald stocks via a brokerage:
Note: As is the case with all regulated stock trading sites, you will first need to open an account and verify your identity. You’ll also need to deposit some funds.Step 1: Search for McDonald’s (MCD) Stock
Brokerages list thousands of equities on its platform. To trade McDonald stock, enter ‘MCD’ in the search box at the top of the screen.
Step 2: Click on ‘Trade’
Click on the ‘Trade’ button to proceed with your stock purchase.
Step 3: Set-Up Order and Buy McDonald’s Stock
Set your trade parameters.
These include:
- Amount: You need to enter the total amount that you wish to invest in McDonald’s, and not the number of shares or units. For example, if you want to invest just $10, this is fine. Just enter $10 into the amount box.
- Set Rate: You get to choose the specific price that you want to enter the trade at. For example, if MCD is currently priced at $161, but you want to enter the market at $159, change the order box to a ‘limit’ order. Alternatively, if you’re happy to take the current price, leave the box set to a ‘market’ order.
- Stop Loss: Although not compulsory, we would suggest setting up a stop-loss order. By selecting an exit price, you can ensure that you do not lose too much money in the event that MCD shares begin to drop.
- Take Profit: If you want the broker to automatically close your trade when MCD hits a certain price target, you can do this via a take-profit order.
Finally, click on ‘Buy’ to complete your McDonald’s stock order.
Why Do People Invest in McDonald’s?
McDonald’s shares declined by just over 20% in March 2020 as a result of the COVID-19 pandemic. This was in relation to the wider US stock market decline that saw the economy take a massive blow.
Home Delivery Expansion is Going Well
It is somewhat surprising that it took McDonald’s as long as it did to move into the ever-growing home delivery space. Nevertheless, the company has since entered the digital delivery niche and consumers can now have food sent straight to their home when they place an order via the MCD mobile app.
Increased Investments in Cutting-Edge Technologies
On top of home deliveries, McDonald’s is also increasing its focus on cutting-edge technologies. At the forefront of this is its investment in artificial intelligence (AI). Whether it’s through the company’s mobile app or in-store kiosks, this allows the company to understand customer wants and needs in an automated manner.
Comparable Global Sales Grow for 17th Consecutive Quarter
The industry leader’s most recent earnings report noted that comparable global sales grew for the 17th consecutive quarter. This means that outside of its US market, McDonald’s continues to record unprecedented success.
The earnings report notes that this was largely due to its focus on offering products to suit all budgets. For example, customers have the choice of the premium Signature Menu or the Dollar Menu for those that are on a tighter budget.
Consistent Dividends Policy
Its shareholders are further rewarded via the company’s consistent dividends policy. More specifically, McDonald’s has increased its dividend payment every year since it started distributing them in the mid-1970s.
About McDonald’s Stock
Company and Stock history
McDonald’s is a global fast-food chain and an internationally recognized brand that traces its roots back to 1940. Initially, a one-store business in California, McDonald’s currently runs more than 37,000 stores worldwide. And its 1.7 million employees help serve more than 68 million customers each day.
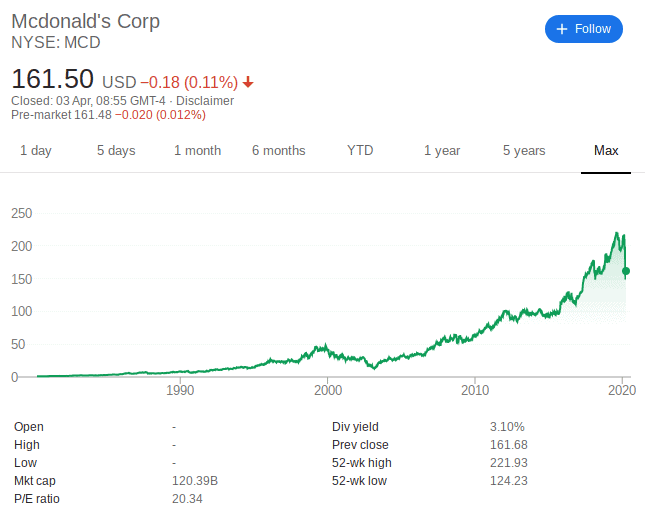
McDonald’s went public in 1965 and listed with the New York Stock Exchange with its shares originally going for $22.50. While the stock reached an all-time high of $218 in mid-2019, this doesn’t reflect its rapid success over the past five decades.
This is because McDonald’s has initiated about 12 stock splits since it went public. This means that had you bought 100 shares valued at $2,250 during its 1965 IPO, this investment would now be valued at $12 million. In addition to this, you’d be entitled to between $300-$400k in dividends annually.
McDonald’s Stock
The food company continues to increase its dividend with every payout.
The direction that CEO Steve Easterbrook is taking McDonald’s is also notable. This centers on moving the fast-food chain into the digital age. For example, the company is spending vast resources on its home delivery rollout, as well as incorporating AI technologies to better personalize orders. We should also mention that under Easterbrook’s management, the company is mid-way through a huge store revamp project.
The overarching concept is to bring outdated stores into the modern age and attract those that would otherwise be put off by the traditional fast-food setting. Easterbrook is also keen to expand the company’s ‘healthy’ range, by offering a range of healthy meal options.

Conclusion
McDonald’s stocks have gone from strength-to-strength since going public in 1965. With a current share price of $161, the company would only need to hit a 35% recovery to surpass its peak price of $218.
Glossary of Stocks Terms
StockA stock is a representation of a company’s equity. When a company wants to raise capital, it issues stocks to the public. It is the aggregation of the total stocks owned by one individual that inform their shareholding of the company.
SharesA share is an indivisible unit of capital that expresses the ownership relationship between a shareholder and a particular company, mutual fund, REITs or limited partnership. A share indicates a portion of ownership (claim) that one has on a company or fund.
DividendDividend refers to the portion of the company’s profits that is distributed to its stockholders. It can be on a quarterly or annual basis.
Bull marketA bull market is an economic condition where the stock markets are in an extended period of consistent increase in stock prices.
Bear MarketA stock market is said to be bearish if it is involved in extended periods of continuous price decrease of the stock prices.
Stock ExchangeA stock exchange is an institution or a platform where shares and stocks and a host of other money market instruments are traded.
Return On Investment (ROI)The return on investment is the profit you make from trading in or investing in shares and stocks of a particular company. It often comes from selling the investment at a higher price than was originally bought or benefiting from dividends and other profit-sharing schemes as a result of owning and holding onto a particular investment.
BrokerA broker may be a person or entity that engages in the buying and selling of different types of investments on behalf of other individuals or entities at a fee (or commission).
Day TradingDay Trading is the practice of buying a money market investment product and selling it as soon it reports price increase or loss, within the same day. Traders engaged in day trading are referred to as “day traders” or “active traders”
ArbitrageArbitrage is the act of buying and selling security at different stock exchanges or markets with varying prices. If, for instance, stock ABC sells at $11 on one exchange and $11.75 on the other, arbitraging involves buying from at the low price exchange and profiting by selling it at the higher-priced exchange.
IndexA stock index is a statistical measure of the change in the stock and securities market. It comprises a hypothetical portfolio of different companies whose change in prices is calculated to determine market performance.
Initial Public Offering (IPO)The Initial Public Offering refers to the sale of company stock to the public for the first time. It is the act of taking a company public and is highly regulated by such financial regulators like the SEC in the USA and FCA in the UK.
OptionsOptions are derivative financial instruments whose price is based on the value of their underlying tradable security like shares and stocks. They are contracts that give the holder an option to buy or sell the underlying asset at a later date. Unlike futures, an options contract holder has the choice to buy/sell or not.
Call optionsThis is an options contract that gives the holder an option to buy the underlying asset before the expiry date.
Sell optionsThis option gives its holder the choice of selling the underlying asset before its expiry date
Mutual FundsA mutual fund refers to a company that pools funds from different investors and invests these funds in stocks, bonds, and other financial market securities. They then distribute the capital gains from these invests to their members.
Over-the-CounterThe process through which stocks for companies that are not listed with accredited stock exchanges like the NYSE are traded. It is a broker-dealer network for unlisted stocks for companies that do not meet listing requirements set by the organized exchanges.
OverboughtA stock is said to be overbought if it is traded excessively over a short period of time and at unjustifiably high prices.
OversoldA stock is said to be oversold if it is consistently traded below its true value.
Ask PriceAlso referred to as the offer or asking price, this refers to the lowest price that the seller will take for a stock.
Bid PriceBid price refers to the maximum price that a buyer is willing to pay for a stock.
VolumeIn the stock trading context, Volume refers to the number of shares that change hands within a given period of time, be it a day, month or annually. It is trading/investment indicator where rising trade volumes point to a healthy stock while dwindling volumes are indicators of investor pessimism towards a stock.
VolatilityRefers to the statistical measure of the change in price of a stock over a given period of time. It is a measure of the rate and the time it takes for a stock price to move from high to low and how long it remains within a certain price range. The higher the volatility, the higher the risk.
52-Week HighThis refers to the highest closing price recorded by a given stock in the last 52 weeks.
52-Week LowThis refers to the lowest closing price that a particular stock recorded in the last 52 weeks.
Bid-Ask SpreadThe bid-ask spread refers to the difference between the lowest price that a seller is willing to take for their stock and the highest price that a buyer is willing pay for the stock. It is the difference between the quoted ask and bid prices.
Market OrderA market order is an instruction by an investor to the broker or brokerage platform asking them to buy/sell a stock or any other security at the best price available at that moment. It is often issued when an investor wishes to enter or exit the market quickly and at the prevailing rates.
Limit OrderA limit order is an order that triggers a sale or buy when a predetermined or better price is met. For a buy limit order, the buy order is executed once the set limit price or a better price is triggered. The sell limit order on the hand triggers the sale of stocks if the limit price or better price is hit.
Stop OrderAlso referred to as a stop loss order, it is an order that triggers a buy or sell action once a predetermined price level is hit. It is designed to help you minimize possible loss on a given trade should the markets move against your bet.
Take ProfitTake profit is a type of limit order dictating the price level at which the broker or brokerage platform is to close a trade for profit.
Capital GainsCapital gain refers to the value rise of a tradable financial instrument that makes its selling price higher than the buying price. It can also be referred to as the profit realized from liquidating a capital investment like stocks.
ETFsAn ETF is a collection of many tradable instruments like bonds, stocks, and commodities. These are listed on the exchanges and traded like ordinary stocks.
Debt-to-Equity RatioThe debt-to-equity (D/E) ratio is a financial ration tool used to measure the financial health of a company by gauging value of its equity in relation to debt. It is achieved by dividing the company’s total liabilities in relation to its shareholder’s equity.
Dividend InvestingThis is an investment strategy where the investor only buy shares that have consistently paid out high dividends in the past or others with the fastest dividend rates. Dividend investing strategy advocates are more interested in how much a shares pays in dividends than its price fluctuations.
Growth StocksGrowth stocks refers to the stocks of companies that are expected to grow at a faster rate than the industry average and report consistent and sustainable cashflows. The company sales and revenues are also expected to increase at a faster than that of an average company in the same industry.
Penny StocksThese are also referred to as micro-cap or nano-cap stocks and refers to the stocks of relatively small companies valued less than $5 and only trade via the Over-The-Counter markets.
Blue ChipA blue chip refers to a nationally recognized and financially sound company with a long and stable record of consistent growth. It is company whose financial might and nature of operation make it well suited to face turmoil and remain profitable in the uncertain economic conditions..
Short SellingShort selling is a trade/investment strategy where the investor is banking on the decline of the shares of a particular company. They therefore borrows these shares, sells them at the current market price and buys them back after they lose value, effectively profiting from the price difference.
YieldYield refers to the profit/earnings generated from investing in a particular stock or market instrument over a given period of time and is expressed a percentage of the stock’s market value, face value or as percentage of invested amounts.
Capital StockCapital stock, also referred to outstanding shares, refers to all the regular shares issued by a company and held by all its shareholders including the restricted/locked-in shares held by company insiders, executives, and institutional investors. The number of capital stock is used in calculating key metrics including cash-flow per-share and earnings per share.
Earnings Per Share (EPS)EPS refers to the monetary value, the profit or earnings attributable to each outstanding shares held by a company. It is a financial ratio that is arrived at by dividing the company’s profit by its outstanding shares of the common stock.
Price Earning Ratio (PER)Also referred to as Price-to-earnings ratio, PER is a financial metrics tools used to check if a company’s shares are over/undervalued by dividing the shares current market price with its earnings-per-share.
FloatA company’s flat refers to the number of regular shares issued to investors that are available for trading. The float shares figure is arrived at by subtracting the locked-in shares held by company insiders and executives from its capital stock.
Gap-up StocksGap up stocks refer to company stocks that open the day trading at relatively higher prices than their previous day’s closing price. This is often attributed to the after-market trading activity.
Gap-Down StocksGap down stocks refers to company stocks that open the day trading at relatively lower prices that the previous day’s closing price. For instance if a company stock closes the day trading at $50 but opens the following day trading at $45, it is said to have a 5-point gap down.
Stock BuybackStock buyback, also referred to as share repurchase, occurs when a publicly listed corporation uses a part of its revenues to buy back its shares from the marketplace. The move effectively reduces the number of company shares in circulation, which translates to an increased share price.
HOLDHOLD is a financial recommendation issued by a qualified financial institutions or financial analyst advising investors/traders not to buy or sell a particular stock. It is a no-action situation where long position traders are advised not to sell and others investors advised not to buy into the stock.
Resistance LevelsThis refers to the upper-most price level that a particular stock or any other security reaches but doesn’t exceed due to dwindling number of buyers and an increasing number of sellers.
MacroeconomicIs a branch of economics that’s concerned with the study of how the economy and different large-scale markets are structured, how they behave, and how they perform.
RSIRelative Strength Index is a technical momentum indicator used in market analysis to determine if a stock is overbought or oversold by measuring the magnitude of a recent bullish or bearish price run. It has a scale of 0-100 where RSI readings of 70+ indicate a stock is overbought while an RSI reading below 30 is an indicator of an oversold security.
Moving AverageMoving Averages is a statistical calculation that is specially designed to identify the arithmetic mean of a given number of data sets or range of prices calculated over a given period of time. Each of these data set or price range is created by the average/mean price for that subset. For instance, a single data point on a moving averages scale may represent the average stock price for a day or trading session.
Bollinger BandsBollinger Bands are a technical indicator tool characterized by two statistical carts that run alongside each other indicating the changes in prices and volatility of a financial instrument like stock or commodity over a given period of time.
Fibonacci RetracementsFibonacci retracements refer to two horizontal lines that use the Fibonacci numbers to measure the percentage of price retracement in a bid to indicate where the resistance and support are most likely to occur.
FAQ
How much were McDonald’s stocks originally?
When McDonald’s first went public in 1965, its IPO priced the stocks at just $22.50. Had you purchased 100 shares at the time, they would now be worth more than $12 million.
Why does McDonald’s keep doing stock splits?
McDonald’s has engaged in 12 stock splits since its 1965 IPO. Much like any other stock split, the company has done this as a means to reduce its stock price (proportionate to the value of the company). In doing so, it allows everyday retail investors to purchase MCD stocks at an affordable level.
Does McDonald’s pay dividends?
It certainly does. In fact, McDonald’s has increased its dividends payment every year since it paying them. This makes MCD a great option if you’re seeking an income-generating investment.
Do I need to buy whole McDonald’s shares?
Although McDonald’s has employed 12 stock splits to reduce the cost of purchasing whole shares, this is no longer a required. The reason for this is that a number of online brokers now allow you to buy fractional shares.
What stock exchange are McDonald’s stocks listed on?
McDonald’s is listed on the New York Stock Exchange, which is the largest stock exchange in the world.
Who owns McDonald’s?
McDonald’s is a publically-listed company, meaning that it is owned by its shareholders. The current CEO of the company is Steve Easterbrook.

Kane Pepi
Kane Pepi
View all posts by Kane PepiKane holds academic qualifications in the finance and financial investigation fields. With a passion for all-things finance, he currently writes for a number of online publications.
WARNING: The content on this site should not be considered investment advice. Investing is speculative. When investing your capital is at risk. This site is not intended for use in jurisdictions in which the trading or investments described are prohibited and should only be used by such persons and in such ways as are legally permitted. Your investment may not qualify for investor protection in your country or state of residence, so please conduct your own due diligence. Contracts for Difference (“CFDs”) are leveraged products and carry a significant risk of loss to your capital. Please ensure you fully understand the risks and seek independent advice. This website is free for you to use but we may receive commission from the companies we feature on this site.
Copyright © 2026 | Learnbonds.com
We use cookies to ensure that we give you the best experience on our website. If you continue to use this site we will assume that you are happy with it.Scroll Up