How to Buy Barclays Stock
Barclays is a major UK financial institution involved in the retail, corporate, and investment banking sectors.
The company is publicly listed on the London Stock Exchange (LSE) and forms part of the FTSE 100 index. And while Barclays is currently worth just a fraction of its pre-2008 value, this makes today, probably the best chance to purchase shares on the cheap.
In this article, not only do we give you a step-by-step guide on how you can buy Barclay stock, but we also list two top-rated brokerages where you can Barclays stock. Read on to find out how to invest in Barclays today.
-
-
How to Buy Barclays Stock in 3 Quick Steps
Want to purchase Barclays stock right away? Follow this 3-step guide:
[three-steps id=”194857″]Where to Buy Barclays Stock
As an FTSE 100 blue-chip company, there are several online stock brokers that allow you to buy Barclays shares at the click of a button. You only need to open an account, deposit some funds, and you’re good to go. To help you along the way, we’ve listed our top brokers below:
RECOMMENDED BROKER

Rating
What we like
- 0% Commission
- Trade Stocks Via CFDs
- Authorized & regulated by the FCA
Min Deposit
$100
Charge per Trade
Zero Commission
Available Assets
- Total Number of Stocks & Shares+2000
- US Stocks
- German Stocks
- UK Stocks
- European
- ETF Stocks
- IPO
- Funds
- Bonds
- Options
- Future
- CFDs
- Crypto
Charge per Trade
- FTSE 100 Zero Commission
- NASDAQ Zero Commission
- Dax Zero Commission
- Facebook Zero Commission
- Alphabet Zero Commission
- Tesla Zero Commission
- Apple Zero Commission
- Microsoft Zero Commission
Deposit Method
- Wire transfer
- Credit Cards
- Bank Account
- Paypal
- Skrill
Detailed Provider Review
1. eToro – Best Stock Broker for Worldwide Customers
eToro is an industry leader in the online CFD, forex, and stock brokerage space. The platform lists thousands of publicly-listed companies across dozens of stock markets. Not only does this include stocks listed with the London Stock Exchange, NASDAQ, and the New York Stock Exchange. eToro is a notable option if you're just starting out, as the process of opening an account and depositing funds is relatively easy.
You'll get to choose from a debit or credit card, an e-wallet like PayPal, or bank transfer, and the minimum deposit starts from $50. eToro supports fractional share trading, so you can invest as little as you like. This means that you can diversify by adding alternative FTSE 100 stocks to your portfolio. In terms of regulation, eToro holds licenses with the UK's FCA, Australia's ASIC, and CySEC in Cyprus.
We are also drawn to eToro because it allows you to buy Barclays shares without paying any trade commission. Other than the spread and a small $5 withdrawal fee, there are no other costs to take into consideration. Finally, it is also worth considering the Copy Trading feature available at eToro.
Our Rating

- Catered to newbie traders
- 0% commission on ETFs and stocks
- Supports heaps of everyday payment methods
- Minimum withdrawal of $50
- High spreads
- MT4/5 not available
75% of investors lose money when trading CFDs.2. Plus500 – Hosts a wide range of advanced technical and analysis tools
Want to enjoy all the benefits of CFD trading? Considering creating a user account with Plus500. This is beneficial for two key reasons; firstly, CFDs allow you to short-sell stocks and shares, meaning that you can speculate on the value of Barclays going down. Secondly, you can also apply the leverage of up to 1:300 on most CFD trades; this means that you can invest more into Barclays stocks than you have in your account.
Trading spreads, though variable are highly competitive and you get to trade shares and stock CFDs commission-free. Registering a trader account with the CFD broker is also relatively easy and straightforward. Plus you only need a minimum $100 initial deposit to activate your account.
There are no deposit/withdrawal fees. The online CFD is also highly reputable as it is not only listed and publicly traded on the London Stock Exchange but Plus500 UK LTD is authorized and regulated by FCA.
It also supports several payment processing service providers including debit/credit cards, e-wallets like PayPal, and bank transfer. If you fancy investing in other assets, Plus500 plays host to over 2,000 financial instruments that include oil, gold, natural gas, indices, bonds, Forex, indices, and cryptocurrencies - all traded as CFDs.
Our Rating
- Hosts a range of premium analysis tools
- No commission on stock CFD trades
- Tight variable spreads
- Stocks only available via CFDs
- Charges overnight funding fees
80.5% of retail CFD accounts lose money.How to Buy Barclays Stock from eToro
Here is a step by step guide on how to buy Barclays shares through Toro:
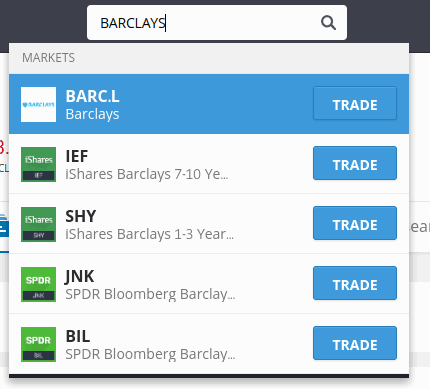
Note: You will need to verify your eToro account before you can invest in Barclays. The process is automated, and simply requires a copy of your government-issued ID. This can be a passport or driver’s license.Step 1: Search for Barclays (BARC) Stock
eToro offers a highly extensive stock trading platform, which consists of thousands of shares across dozens of stock markets. As such, you are advised to type in ‘BARCLAYS’ into the search box at the top of the screen and then click on the result that pops up.

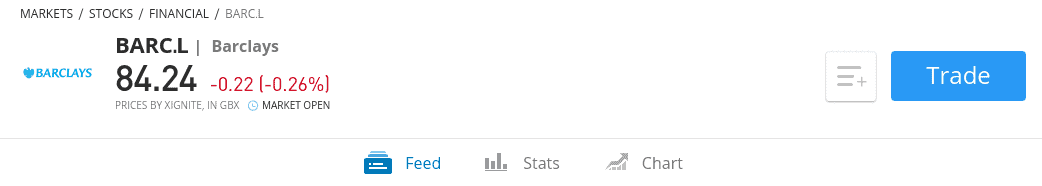
Step 2: Click on ‘Trade’
You will now need to click on the ‘Trade’ button, which will then populate the order form.

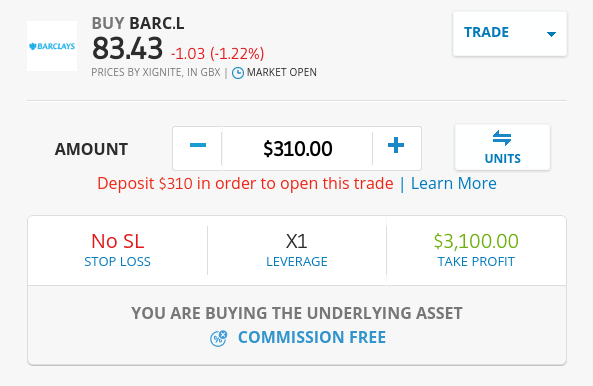
Step 3: Set-Up Order and Buy Barclays Stock
On the pop-up buy/sell window, set up your trade parameters.

These include:
- Amount: This is the amount that you wish to invest in Barclays stock in monetary terms, and NOT the number of shares. For example, if you’re planning to buy $400 worth of shares, enter $400 into the ‘amount’ box.
- Set Rate: If you simply want to buy Barclays stock at the next available price, leave the set rate as a ‘market order’. If you want to buy Barclays stock when the shares hit a certain price, opt for a ‘limit order’.
- Stop Loss: By installing a stop-loss order, you will be able to mitigate your risks in the event the markets go against you. You get to specify the exact price that the system should exit your trade.
- Take Profit: You should also consider setting up a take-profit order. Much like a stop-loss order, you get to specify the price that the broker should close your trade. However, this is with respect to your profits.
Finally, click on ‘Buy’ to complete your order.
Why Invest in Barclays?
Here are some of the reasons why you should consider adding the Barclays stock to your investment portfolio:
Huge Upside Potential
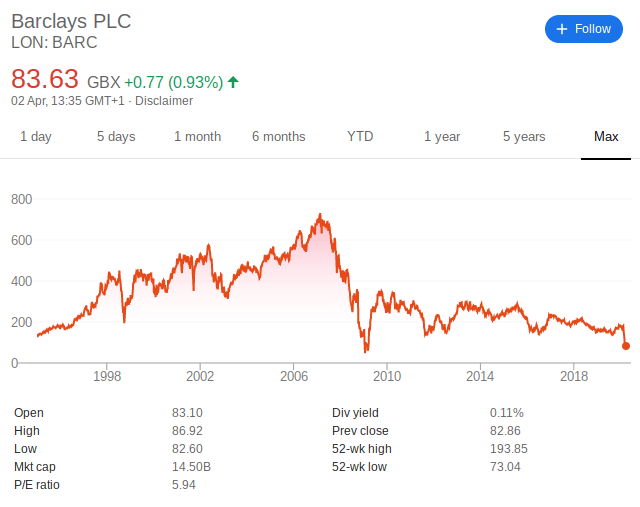
There has never been a better time to invest in Barclays, at least over the past two decades. This sentiment is further amplified when you consider just how quickly its share price went down on the back of the Coronavirus pandemic. Barclays last reached its all-time high of 749p per share in mid-2008.
Fast forward to late 2019 and the shares were hovering around the 170p-190p range. As per the market sell-off of March 2020, the shares are now priced at just 87p. This means that you have the opportunity to purchase the stocks at an 88% discount compared to 2008 and reap immensely if this price increases after 2019.
Recent Financials Were Positive
Although there is no getting away from the fact that Barclays stock have plummeted in recent years, the financials of the company are beginning to look positive. For example, Barclays reported a 25% increase in profits before tax in its most recent financial statements.
The report also highlighted a 2% increase in income, taking the overall figure to £21.6 billion. We should also make reference to the company’s consistent dividend policy, with its most recent payment reflecting a 38.5% increase from the year prior.
Taking Control of its Operating Costs
One of the biggest pain-points facing Barclays management over the past few years has been the company’s inability to reduce its operating costs. With that said, recent reports indicate that Barclays is finally getting a grip on non-revenue generating spending.
For example, Barclays reported a 2% decrease in year-on-year operating costs in its most recent earnings report. This amounts to a real-term reduction of £4 billion. Much of this was down to the bank reaching its target of reducing physical branches below the 1,000 marks, as well as a reduction of its bad debt portfolio.
About Barclays Stock
Company and Stock history
Barclays is a UK-based financial institution that traces its origins to the late 17th century. The company now operates four main divisions, both domestically and overseas. This includes corporate banking, investment management, wealth management, and its core retail banking services. As a PLC, Barclays is listed on the UK’s London Stock Exchange. In terms of the company’s historical stock journey, Barclays shares have been on a somewhat turbulent ride over the past few decades.

For example, the bank enjoyed a successful period between 1995 and 2007, where its shares rocketed from a low of 140p, up to a high of well past 700p. Interestingly, Barclays was also behind a proposed multi-billion-dollar takeover over the now-defunct Lehman Brothers, albeit, the move was blocked by the then UK Chancellor, Alistair Darling.
However, this was as good as it got for Barclays, as its shares have been on a downward decline ever since. Record lows were hit in mid-2008, with its shares costing just 48p. Between 2011 and 2020, its shares enjoyed a long period of stability by staying within the 170p-190p range.
Barclays Stock
The overarching question is whether or not you believe Barclays can relive its pre-2008 glory. Based on current prices, it would take a bullish rally of more than 700%. Sure, this is a huge upside, but entirely unlikely. Even if Barclays was able to breach its all-time high of 749p, it would take more than a few years.
Someone might argue that a rebound to its pre-COV-19 pandemic levels is a more realistic target.
The post covid business environment is expected to post a sharp increase in profits, revenues, and dividend payments. The management has also made it clear that they are looking to place less of a reliance on bulky high street branches and venture online.
Should I Buy Barclays Stock?
In summary, Barclays is far from a high-grade stock right now. In fact, it hasn’t been for well over a decade. Sure, it’s got a consistent dividend policy record, but any income derived from its shares have been whipped out by its disastrous stock market performance. The tides had started to turn in favor of the UK bank just before the COVID-19 pandemic struck, which subsequently saw the banker lose close to 50% of its market capitalization.
One may argue that the drop was unwarranted, and not indicative of the bank’s recent performance. Profits and gross revenue, for instance, were on the rise, while operating costs were approaching manageable levels. If you, however, are confident that its push for going digital and other measures it has undertaken may help it rebound post-COVID, now is the best time to buy Barclays stock.
Trade with eToro - World Leading Social Trading Platform
Our Rating

- Trade Stocks, Forex, Crypto and more
- 0% Commission on Real Stocks
- Copy Trades of Pro Investors
- Easy to Use Trading Platform
67% of retail investor accounts lose money when trading CFDs with this provider. You should consider whether you can afford to take the high risk of losing your money.Glossary of Stocks Terms
StockA stock is a representation of a company’s equity. When a company wants to raise capital, it issues stocks to the public. It is the aggregation of the total stocks owned by one individual that inform their shareholding of the company.
SharesA share is an indivisible unit of capital that expresses the ownership relationship between a shareholder and a particular company, mutual fund, REITs or limited partnership. A share indicates a portion of ownership (claim) that one has on a company or fund.
DividendDividend refers to the portion of the company’s profits that is distributed to its stockholders. It can be on a quarterly or annual basis.
Bull marketA bull market is an economic condition where the stock markets are in an extended period of consistent increase in stock prices.
Bear MarketA stock market is said to be bearish if it is involved in extended periods of continuous price decrease of the stock prices.
Stock ExchangeA stock exchange is an institution or a platform where shares and stocks and a host of other money market instruments are traded.
Return On Investment (ROI)The return on investment is the profit you make from trading in or investing in shares and stocks of a particular company. It often comes from selling the investment at a higher price than was originally bought or benefiting from dividends and other profit-sharing schemes as a result of owning and holding onto a particular investment.
BrokerA broker may be a person or entity that engages in the buying and selling of different types of investments on behalf of other individuals or entities at a fee (or commission).
Day TradingDay Trading is the practice of buying a money market investment product and selling it as soon it reports price increase or loss, within the same day. Traders engaged in day trading are referred to as “day traders” or “active traders”
ArbitrageArbitrage is the act of buying and selling security at different stock exchanges or markets with varying prices. If, for instance, stock ABC sells at $11 on one exchange and $11.75 on the other, arbitraging involves buying from at the low price exchange and profiting by selling it at the higher-priced exchange.
IndexA stock index is a statistical measure of the change in the stock and securities market. It comprises a hypothetical portfolio of different companies whose change in prices is calculated to determine market performance.
Initial Public Offering (IPO)The Initial Public Offering refers to the sale of company stock to the public for the first time. It is the act of taking a company public and is highly regulated by such financial regulators like the SEC in the USA and FCA in the UK.
OptionsOptions are derivative financial instruments whose price is based on the value of their underlying tradable security like shares and stocks. They are contracts that give the holder an option to buy or sell the underlying asset at a later date. Unlike futures, an options contract holder has the choice to buy/sell or not.
Call optionsThis is an options contract that gives the holder an option to buy the underlying asset before the expiry date.
Sell optionsThis option gives its holder the choice of selling the underlying asset before its expiry date
Mutual FundsA mutual fund refers to a company that pools funds from different investors and invests these funds in stocks, bonds, and other financial market securities. They then distribute the capital gains from these invests to their members.
Over-the-CounterThe process through which stocks for companies that are not listed with accredited stock exchanges like the NYSE are traded. It is a broker-dealer network for unlisted stocks for companies that do not meet listing requirements set by the organized exchanges.
OverboughtA stock is said to be overbought if it is traded excessively over a short period of time and at unjustifiably high prices.
OversoldA stock is said to be oversold if it is consistently traded below its true value.
Ask PriceAlso referred to as the offer or asking price, this refers to the lowest price that the seller will take for a stock.
Bid PriceBid price refers to the maximum price that a buyer is willing to pay for a stock.
VolumeIn the stock trading context, Volume refers to the number of shares that change hands within a given period of time, be it a day, month or annually. It is trading/investment indicator where rising trade volumes point to a healthy stock while dwindling volumes are indicators of investor pessimism towards a stock.
VolatilityRefers to the statistical measure of the change in price of a stock over a given period of time. It is a measure of the rate and the time it takes for a stock price to move from high to low and how long it remains within a certain price range. The higher the volatility, the higher the risk.
52-Week HighThis refers to the highest closing price recorded by a given stock in the last 52 weeks.
52-Week LowThis refers to the lowest closing price that a particular stock recorded in the last 52 weeks.
Bid-Ask SpreadThe bid-ask spread refers to the difference between the lowest price that a seller is willing to take for their stock and the highest price that a buyer is willing pay for the stock. It is the difference between the quoted ask and bid prices.
Market OrderA market order is an instruction by an investor to the broker or brokerage platform asking them to buy/sell a stock or any other security at the best price available at that moment. It is often issued when an investor wishes to enter or exit the market quickly and at the prevailing rates.
Limit OrderA limit order is an order that triggers a sale or buy when a predetermined or better price is met. For a buy limit order, the buy order is executed once the set limit price or a better price is triggered. The sell limit order on the hand triggers the sale of stocks if the limit price or better price is hit.
Stop OrderAlso referred to as a stop loss order, it is an order that triggers a buy or sell action once a predetermined price level is hit. It is designed to help you minimize possible loss on a given trade should the markets move against your bet.
Take ProfitTake profit is a type of limit order dictating the price level at which the broker or brokerage platform is to close a trade for profit.
Capital GainsCapital gain refers to the value rise of a tradable financial instrument that makes its selling price higher than the buying price. It can also be referred to as the profit realized from liquidating a capital investment like stocks.
ETFsAn ETF is a collection of many tradable instruments like bonds, stocks, and commodities. These are listed on the exchanges and traded like ordinary stocks.
Debt-to-Equity RatioThe debt-to-equity (D/E) ratio is a financial ration tool used to measure the financial health of a company by gauging value of its equity in relation to debt. It is achieved by dividing the company’s total liabilities in relation to its shareholder’s equity.
Dividend InvestingThis is an investment strategy where the investor only buy shares that have consistently paid out high dividends in the past or others with the fastest dividend rates. Dividend investing strategy advocates are more interested in how much a shares pays in dividends than its price fluctuations.
Growth StocksGrowth stocks refers to the stocks of companies that are expected to grow at a faster rate than the industry average and report consistent and sustainable cashflows. The company sales and revenues are also expected to increase at a faster than that of an average company in the same industry.
Penny StocksThese are also referred to as micro-cap or nano-cap stocks and refers to the stocks of relatively small companies valued less than $5 and only trade via the Over-The-Counter markets.
Blue ChipA blue chip refers to a nationally recognized and financially sound company with a long and stable record of consistent growth. It is company whose financial might and nature of operation make it well suited to face turmoil and remain profitable in the uncertain economic conditions..
Short SellingShort selling is a trade/investment strategy where the investor is banking on the decline of the shares of a particular company. They therefore borrows these shares, sells them at the current market price and buys them back after they lose value, effectively profiting from the price difference.
YieldYield refers to the profit/earnings generated from investing in a particular stock or market instrument over a given period of time and is expressed a percentage of the stock’s market value, face value or as percentage of invested amounts.
Capital StockCapital stock, also referred to outstanding shares, refers to all the regular shares issued by a company and held by all its shareholders including the restricted/locked-in shares held by company insiders, executives, and institutional investors. The number of capital stock is used in calculating key metrics including cash-flow per-share and earnings per share.
Earnings Per Share (EPS)EPS refers to the monetary value, the profit or earnings attributable to each outstanding shares held by a company. It is a financial ratio that is arrived at by dividing the company’s profit by its outstanding shares of the common stock.
Price Earning Ratio (PER)Also referred to as Price-to-earnings ratio, PER is a financial metrics tools used to check if a company’s shares are over/undervalued by dividing the shares current market price with its earnings-per-share.
FloatA company’s flat refers to the number of regular shares issued to investors that are available for trading. The float shares figure is arrived at by subtracting the locked-in shares held by company insiders and executives from its capital stock.
Gap-up StocksGap up stocks refer to company stocks that open the day trading at relatively higher prices than their previous day’s closing price. This is often attributed to the after-market trading activity.
Gap-Down StocksGap down stocks refers to company stocks that open the day trading at relatively lower prices that the previous day’s closing price. For instance if a company stock closes the day trading at $50 but opens the following day trading at $45, it is said to have a 5-point gap down.
Stock BuybackStock buyback, also referred to as share repurchase, occurs when a publicly listed corporation uses a part of its revenues to buy back its shares from the marketplace. The move effectively reduces the number of company shares in circulation, which translates to an increased share price.
HOLDHOLD is a financial recommendation issued by a qualified financial institutions or financial analyst advising investors/traders not to buy or sell a particular stock. It is a no-action situation where long position traders are advised not to sell and others investors advised not to buy into the stock.
Resistance LevelsThis refers to the upper-most price level that a particular stock or any other security reaches but doesn’t exceed due to dwindling number of buyers and an increasing number of sellers.
MacroeconomicIs a branch of economics that’s concerned with the study of how the economy and different large-scale markets are structured, how they behave, and how they perform.
RSIRelative Strength Index is a technical momentum indicator used in market analysis to determine if a stock is overbought or oversold by measuring the magnitude of a recent bullish or bearish price run. It has a scale of 0-100 where RSI readings of 70+ indicate a stock is overbought while an RSI reading below 30 is an indicator of an oversold security.
Moving AverageMoving Averages is a statistical calculation that is specially designed to identify the arithmetic mean of a given number of data sets or range of prices calculated over a given period of time. Each of these data set or price range is created by the average/mean price for that subset. For instance, a single data point on a moving averages scale may represent the average stock price for a day or trading session.
Bollinger BandsBollinger Bands are a technical indicator tool characterized by two statistical carts that run alongside each other indicating the changes in prices and volatility of a financial instrument like stock or commodity over a given period of time.
Fibonacci RetracementsFibonacci retracements refer to two horizontal lines that use the Fibonacci numbers to measure the percentage of price retracement in a bid to indicate where the resistance and support are most likely to occur.
FAQ
How much were Barclays stocks before the financial crisis of 2008?
Barclays shares were booming in the lead up to the global financial crisis of 2008. In fact, the UK bank hit an all-time high of 749p in 2017. Since then, the shares have been on a downward spiral.
What stock exchange is Barclays listed on?
Barclays have a primary listing on the London Stock Exchange, and the company also forms part of the FTSE 100.
Does Barclays pay dividends?
Yes, Barclays has a consistent history of paying dividends.
Do I need to buy whole Barclays shares?
There is no longer a need to buy Barclays stocks in minimum lot sizes, or even in whole shares for that matter. Instead, a number of online stock brokers now allow you to purchase fractional shares in Barclays, which is great if you only want to risk small amounts.
Who is the CEO of Barclays?
Joining the company in 2015, the current CEO of Barclays is Jes Staley.
Is it possible to short Barclays stocks?
You certainly can. If you think that Barclays stocks will continue to decline in value, you can short them via a CFD platform.
Our Full Range of “Buy Stocks” Resources – Stocks A-Z

Kane Pepi
Kane Pepi
View all posts by Kane PepiKane holds academic qualifications in the finance and financial investigation fields. With a passion for all-things finance, he currently writes for a number of online publications.
WARNING: The content on this site should not be considered investment advice. Investing is speculative. When investing your capital is at risk. This site is not intended for use in jurisdictions in which the trading or investments described are prohibited and should only be used by such persons and in such ways as are legally permitted. Your investment may not qualify for investor protection in your country or state of residence, so please conduct your own due diligence. Contracts for Difference (“CFDs”) are leveraged products and carry a significant risk of loss to your capital. Please ensure you fully understand the risks and seek independent advice. This website is free for you to use but we may receive commission from the companies we feature on this site.
Copyright © 2026 | Learnbonds.com
We use cookies to ensure that we give you the best experience on our website. If you continue to use this site we will assume that you are happy with it.Scroll Up