
In doing research for an article, I had to gather better data regarding the nature of the U.S. bond market. As I was acquiring the data, I realized I should make it more user-friendly and share it. The U.S. bond market may be much different than you think it is. When you get your information piecemeal, and you never consume a good overview, things tend to seem much different than they actually are. Specifically, in this article, I will focus on amounts outstanding by debt type, versus trading volumes by debt type, debt holders by debt type, and other aspects.
The Bond Market vs. the Stock Market
As measured at year-end, the U.S. bond market has been bigger than the U.S. stock market in 24 of the last 25 years. The exception was 1999, when stocks were rather pricey. On average, the market of investment bonds has been 79% larger than the stock market over the last 25 years. At the end of 2012, the bond market was 104% larger.
Below is a chart showing the amount of U.S. bond market debt versus the U.S. stock market capitalization for domestic companies. The figures on the chart are adjusted by nominal GDP, so that all figures are in end-of-2012 nominal-GDP dollars. In adjusted by nominal GDP, we get two effects. (1) We adjust for growth of the economy. (2) We adjust for inflation. The bond and stock markets, like many other markets, have a tendency to grow as the economy grows. We want to remove this influence to get better year-to-year comparisons. Removing the influence of inflation also gives us better year-to-year comparisons. If we do not remove the influence of inflation, the bond and stock markets appear to have grown more over the years than they actually did.
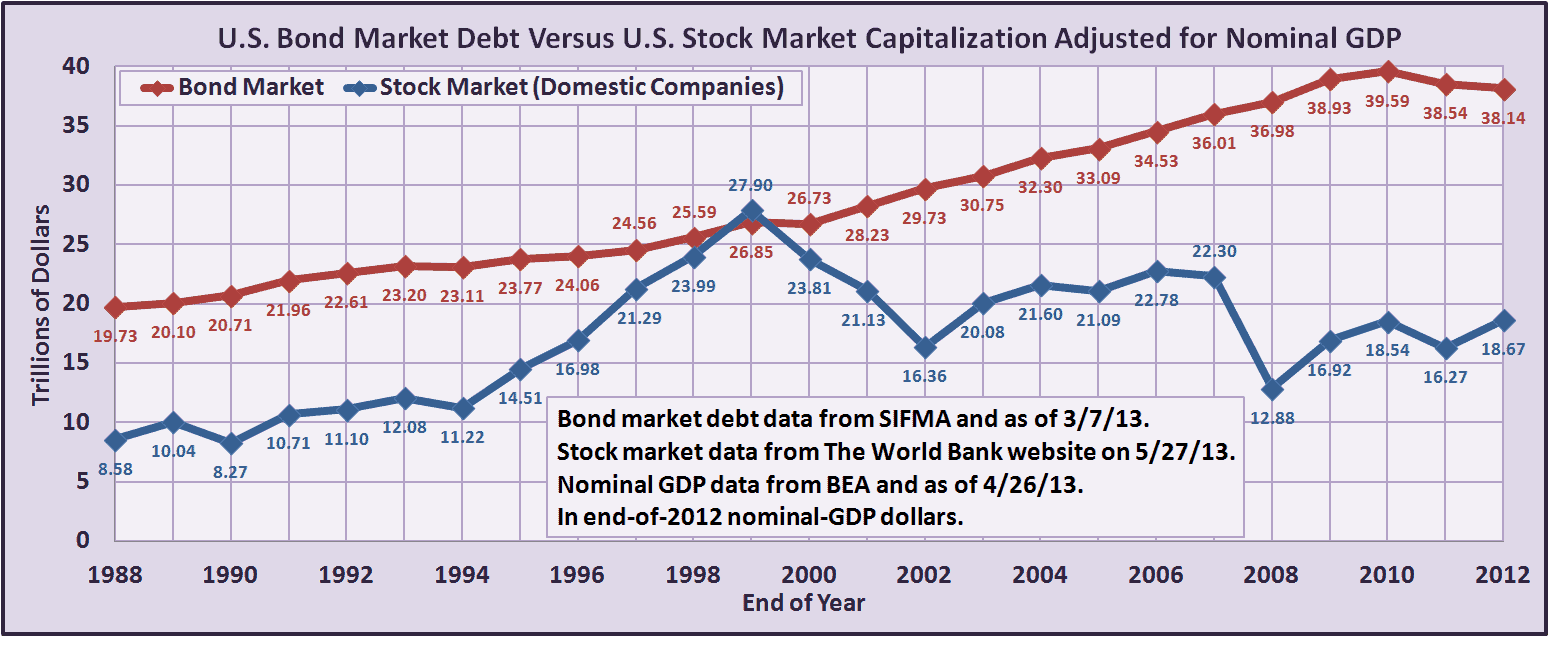
As you can see, the all types of bonds market grew in 20 of 22 years from 1989 to 2010; but it shrunk in 2011 and 2012. The stock market grew at a like pace over the period analyzed. Stock market growth was more erratic due to the volatility of stock prices. Beyond prices, stock market value is dependent on the number and nature of the companies listed on the stock market. At the end of 1988, the S&P 500 had a P/E (price/earnings) ratio of 11.5. At the end of 2012, this P/E ratio was 13.9. This being the case, it appears that about 21% of the growth in the stock market from the end of 1988 thru 2012 was due to prices.
The Bond Market by Debt Type
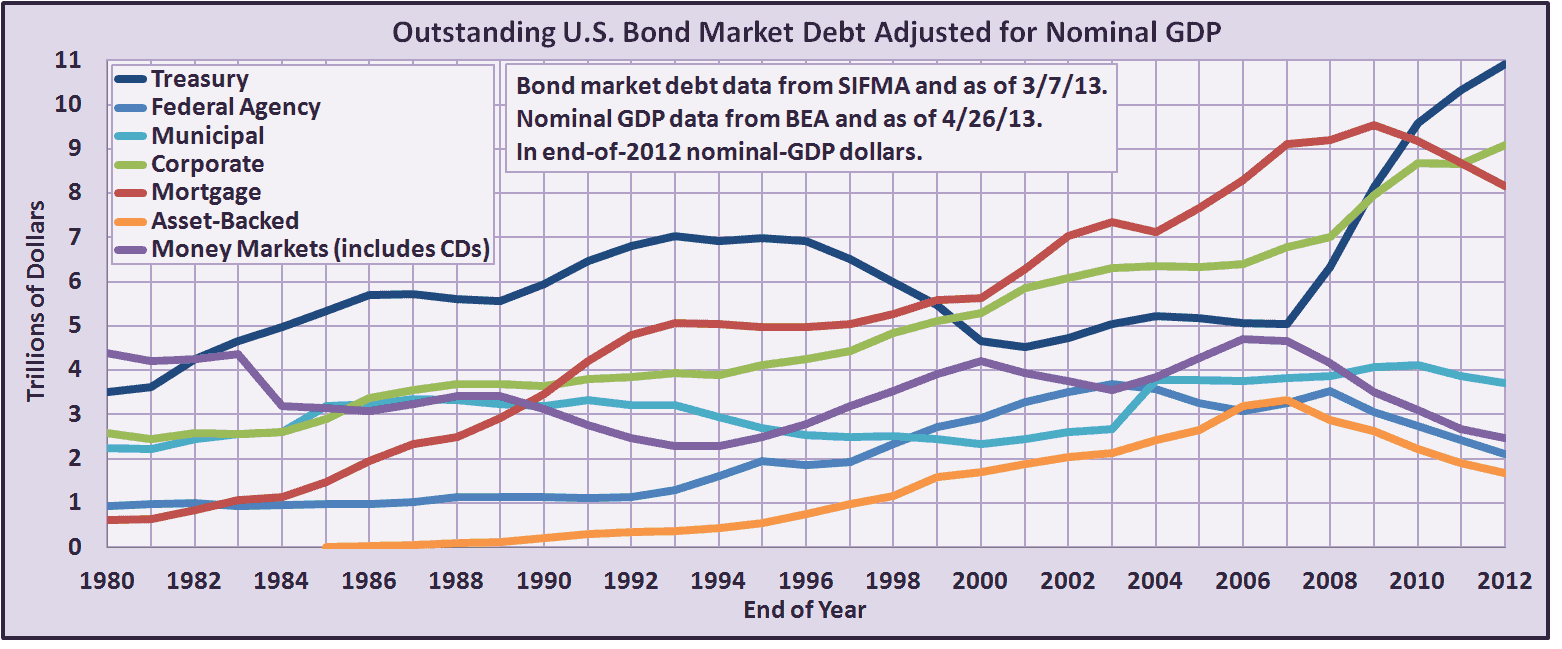
The below chart shows the U.S. bond market size by debt type and covers year-end 1980 thru 2012. The figures on this chart are also adjusted by nominal GDP. Notice that the Treasuries market increased from about $5 trillion to $11 trillion from the end of 2007 thru 2012. The $11 trillion is not the entire U.S. national debt. It is only the public debt. I defined public debt in last week’s article, “How Bad Is the U.S. Debt Situation?” As you could see in last week’s article, the public debt is projected to shrink as a percentage of GDP beginning in U.S. fiscal year 2015 and, then, beginning growing again as a percentage of GDP in U.S. fiscal year 2019.
Adjusted by nominal GDP, the asset-backed market shrunk 49% from the end of 2007 thru 2012, the money markets (including CDs) market shrunk 47% from the end of 2007 thru 2012, the federal agency market shrunk 41% from the end of 2008 thru 2012, the mortgage market shrunk 14% from the end of 2009 thru 2012, and the municipal market shrunk 10% from the end of 2010 thru 2012. The corporate market has grown strongly in recent years, but not as strongly as the Treasuries market.
The SIFMA (Securities Industry and Financial Markets Association) data had a note regarding the municipal numbers. The note said: “Municipal securities restated from 2004 onward and revised upward by about $840 billion.” The increase seemed to all be within the individual bond holder category. SIFMA gathers data from different sources. The jump in municipal market size in 2004 seems to be due to better data versus an actual increase in market size. The fall in money market (including CDs) market size from 1983 to 1984 may also be due to better or worse data, as I am unaware of any event that would have led to such a relatively sudden large fall in market size.
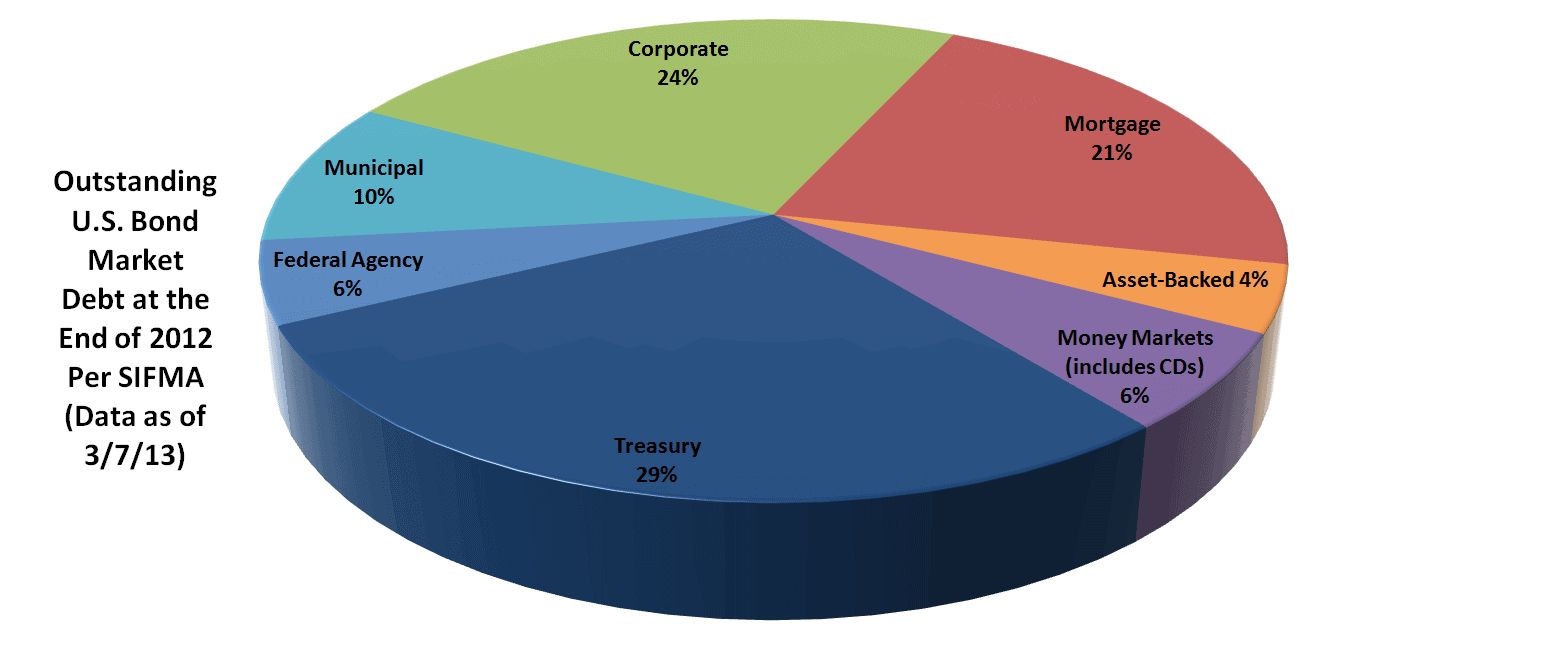
Below are the end-of-2012 market sizes in a pie chart. Total U.S. bond market index funds like Vanguard Total Bond Market ETF (BND) and iShares Core Total U.S. Bond Market ETF (AGG) do not reflect the makeup of the entire U.S. bond market.
Treasuries
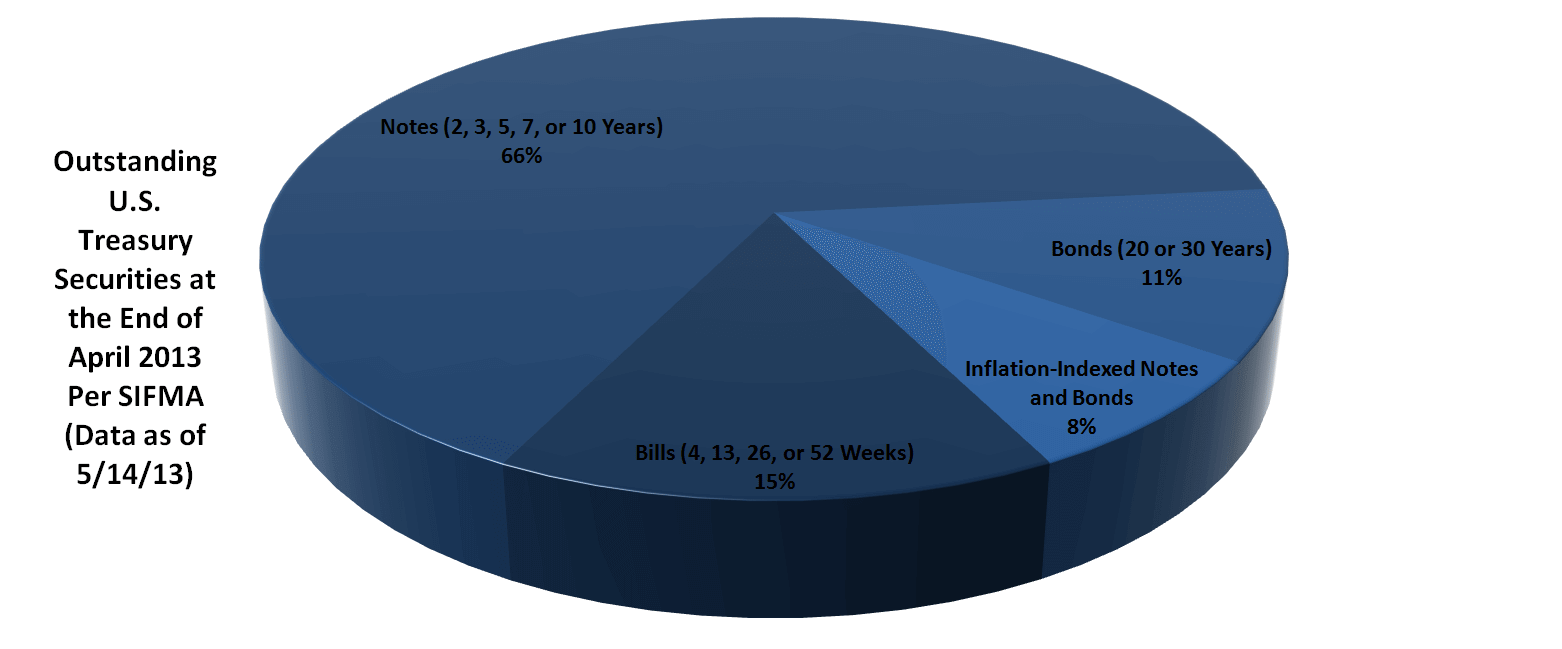
As you can see below, intermediate-term instruments dominate the Treasuries space. Inflation-indexed notes and bonds, such as Treasury Inflation-Protected Securities (TIPS), are only about 2% of the total U.S. bond market.
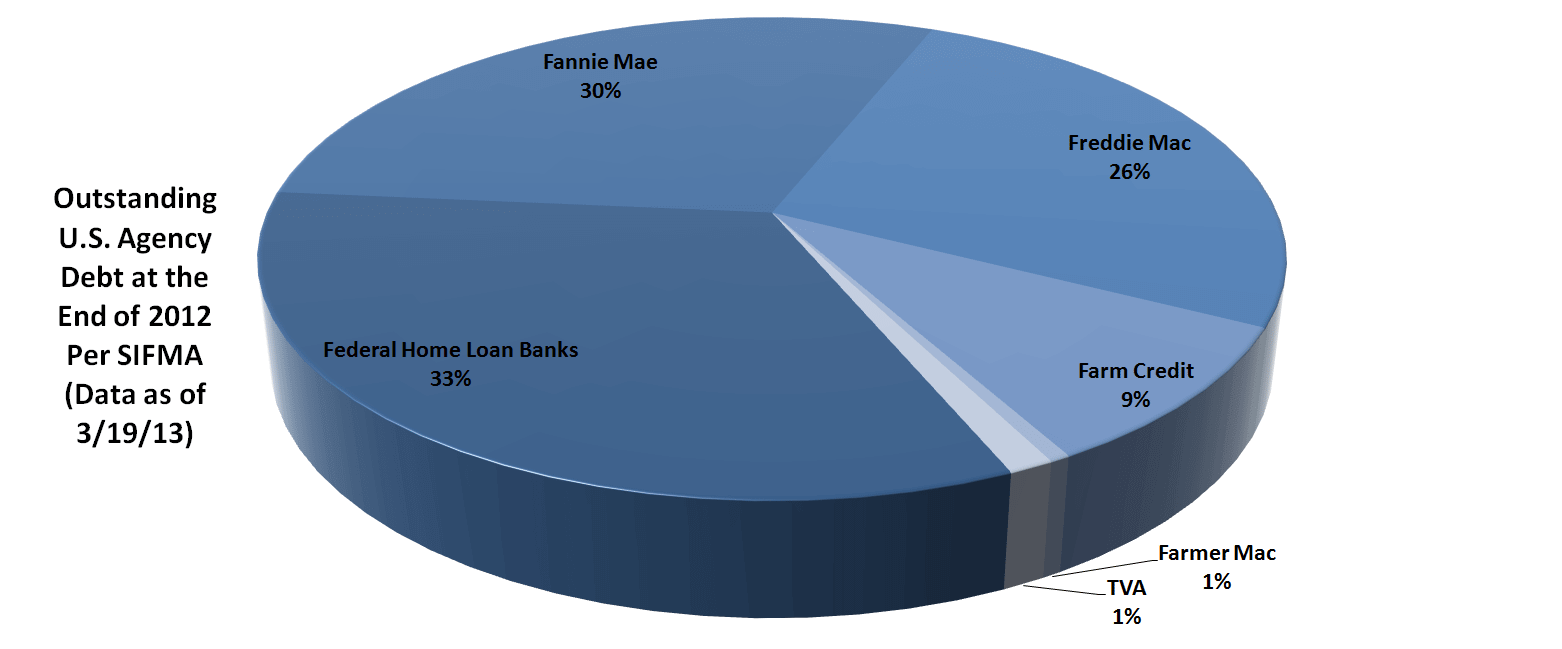
Federal Agency
As mentioned above, the federal agency market shrunk 41% on a GDP-adjusted basis from the end of 2008 thru 2012. Not surprisingly, this was housing-related. Federal Home Loan Banks, Fannie Mae, and Freddie Mac debt all shrunk considerably during this period. Farm Credit, Farmer Mac, and TVA (Tennessee Valley Authority) debt all grew during this period.
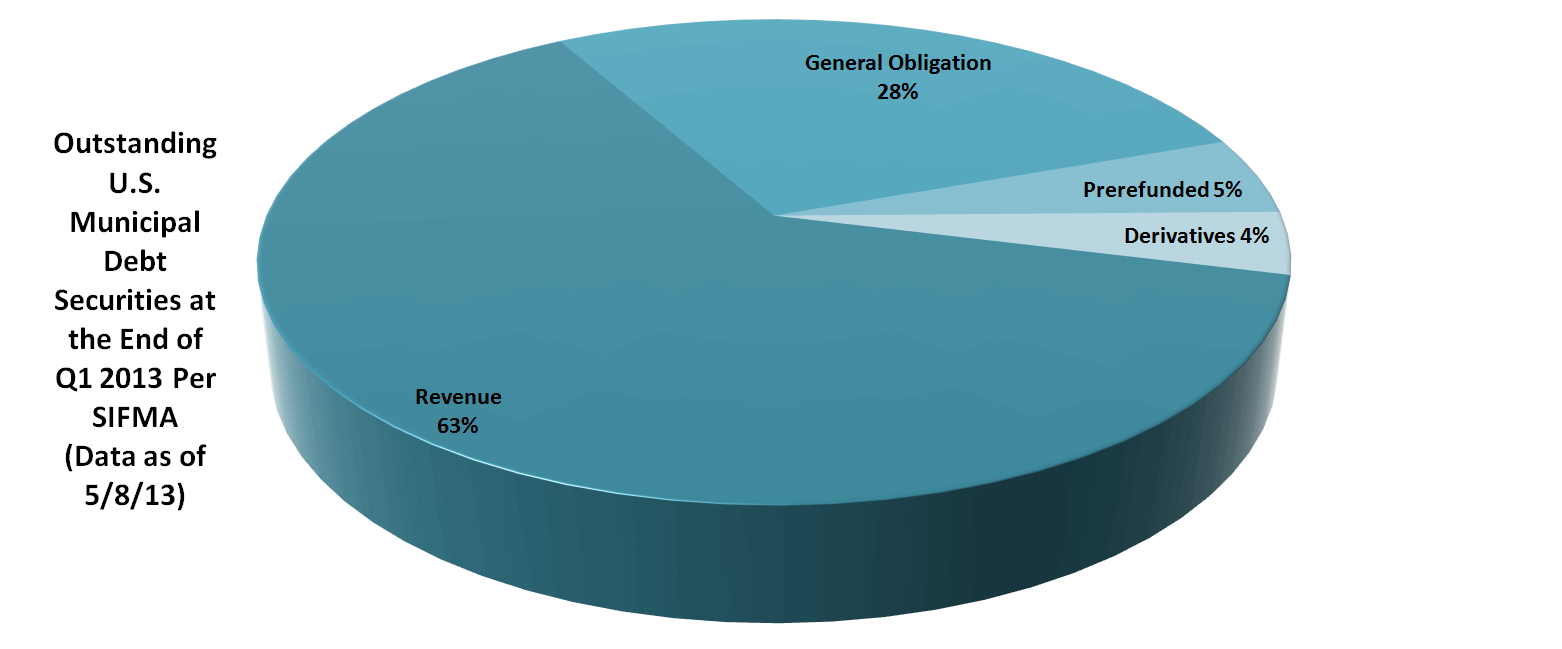
Municipal
Per the SIFMA Q1 2013 Municipal Bond Credit Report: “Despite the recent entry of a new insurer (Build America Mutual), currently only a quarter of all (non-prerefunded/derivative) municipal deals outstanding are insured, compared to a third from only two (actually 1 ¾) years ago…” Revenue bond debt dwarfs general obligation bond debt. Revenue bonds are supported by the revenue from a specific project, such as a toll bridge or road, a stadium, or a water purification plant. General obligation (GO) bonds are supported by taxes. Five percent of municipal bond debt is prerefunded.
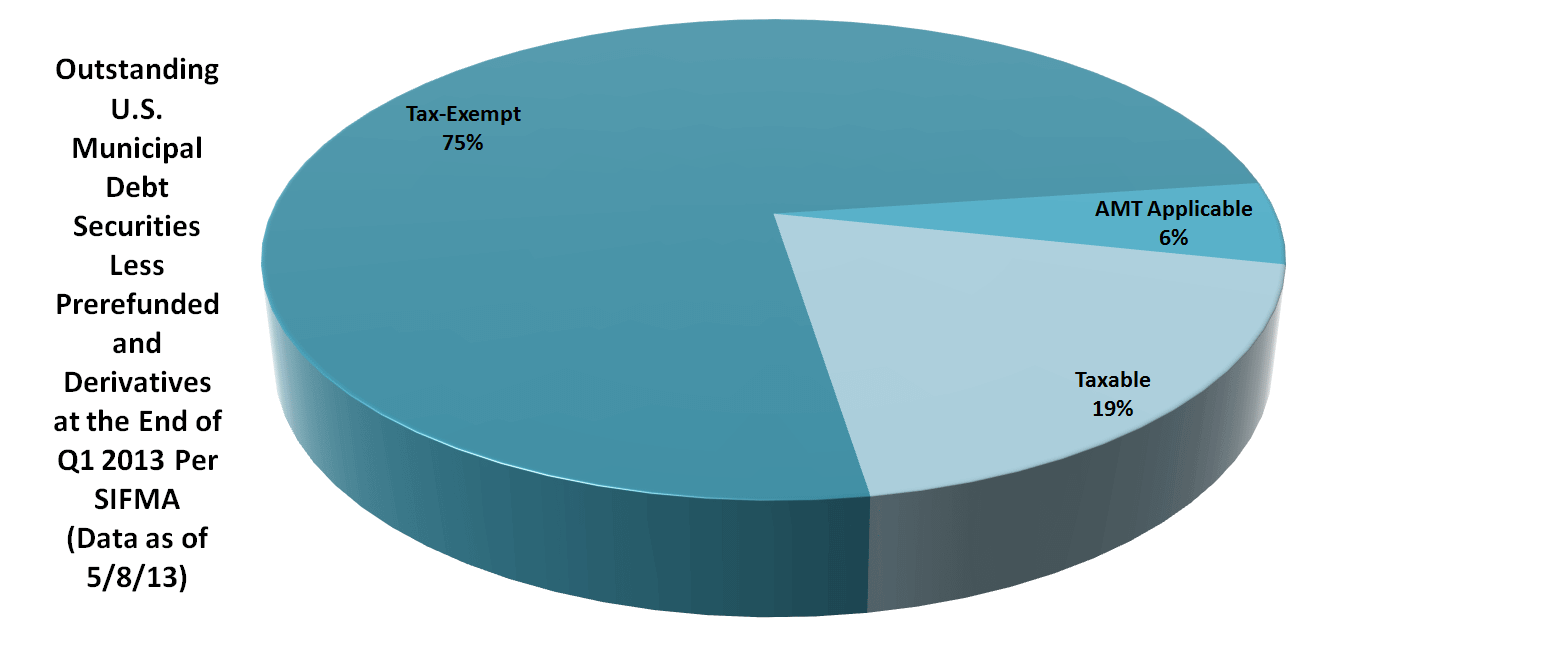
Twenty-five percent of the time, the interest on non-prerefunded/derivative municipal bonds is not federal-income-tax-free or always federal-income-tax-free. About 5% of this is due to the Build America Bonds (BABs) program which ran from April 2009 thru December 2010. The other 20% is not.
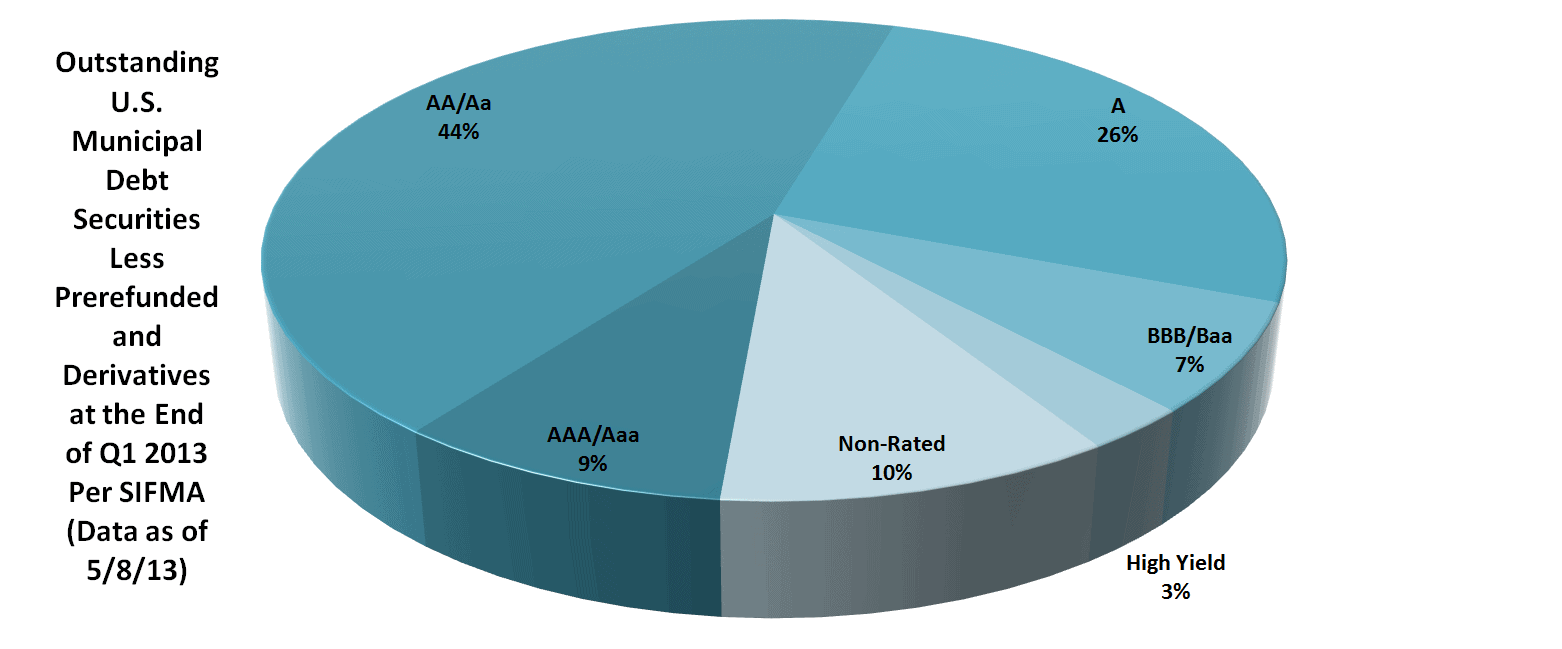
U.S. government debt is rated AAA/Aaa by Fitch/Moody’s and AA+ by S&P. Federal agency debt tends to receive favorable interest rates based upon the implied or actual backing of the agencies by the highly-rated federal government. Ratings vary a lot for municipal bonds; but the vast majority of municipal bonds are investment-grade (AAA/Aaa-to-BBB/Baa). Non-rated bonds tend to be the same quality as high yield (BB/Ba-and-below) bonds. The data in the following chart reflects the lowest S&P, Moody’s, or Fitch rating for each bond.
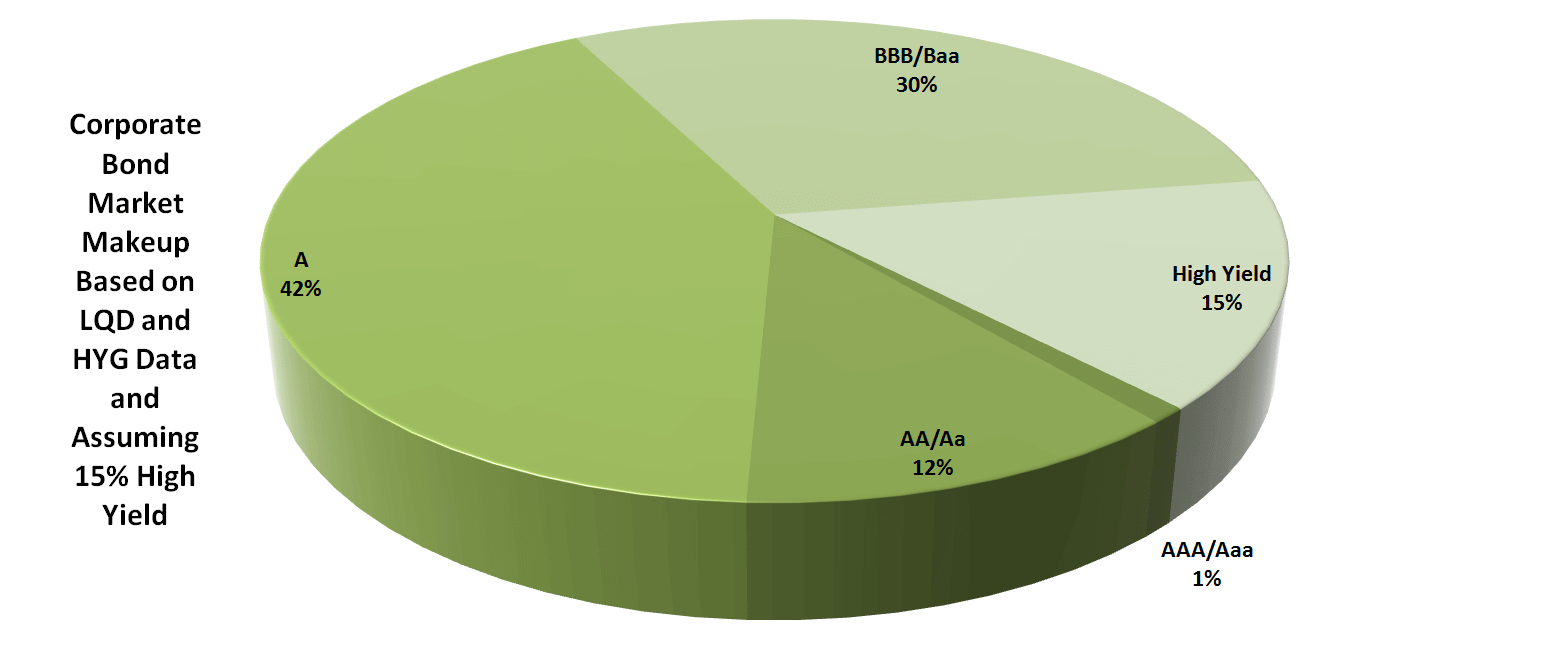
Corporate
Ratings vary a lot for corporate bonds too. Generally, corporate bonds are rated lower than municipal bonds; but, still, the vast majority of corporate bonds are investment-grade. I read, once, that SIFMA said 15% of corporate bonds are high yield. I was unable to find where SIFMA said this; but 15% seems about correct considering other related data. Assuming that 15% is correct and using iShares data for the iShares Investment-Grade Corporate Bond ETF (LQD) and iShares High Yield Corporate Bond ETF (HYG), we get the following speculative picture of the corporate bonds space. The investment-grade data is the average of S&P and Moody’s ratings.
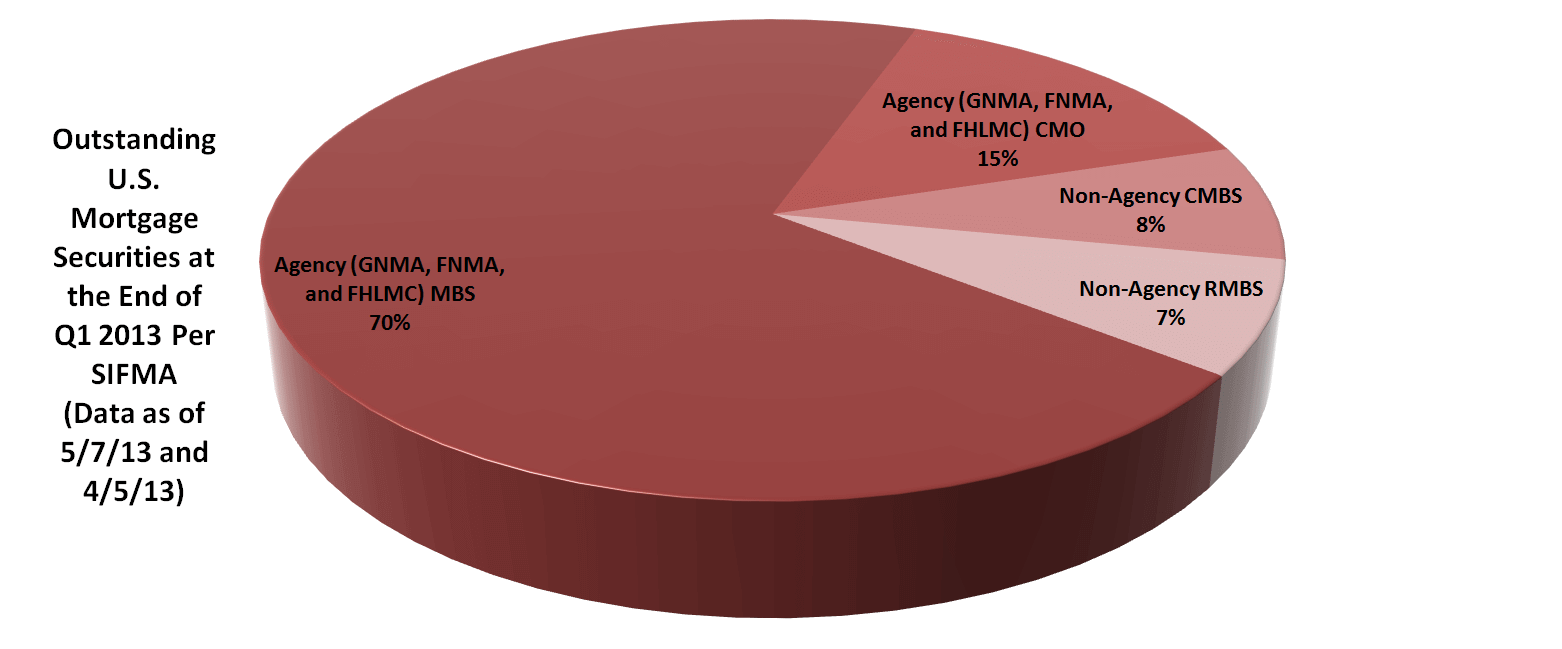
Mortgage
The mortgage bond market is currently dominated by federal agency mortgage-backed securities (MBSs) and collateralized mortgage obligations (CMOs). The agencies involved are Ginnie Mae (GNMA), Fannie Mae (FNMA), and Freddie Mac (FHLMC). For agency MBSs and CMOs, the interest and principal payments are guaranteed by the agency issuing the bond. CMBSs are commercial mortgage-backed securities. RMBSs are residential mortgage-backed securities.
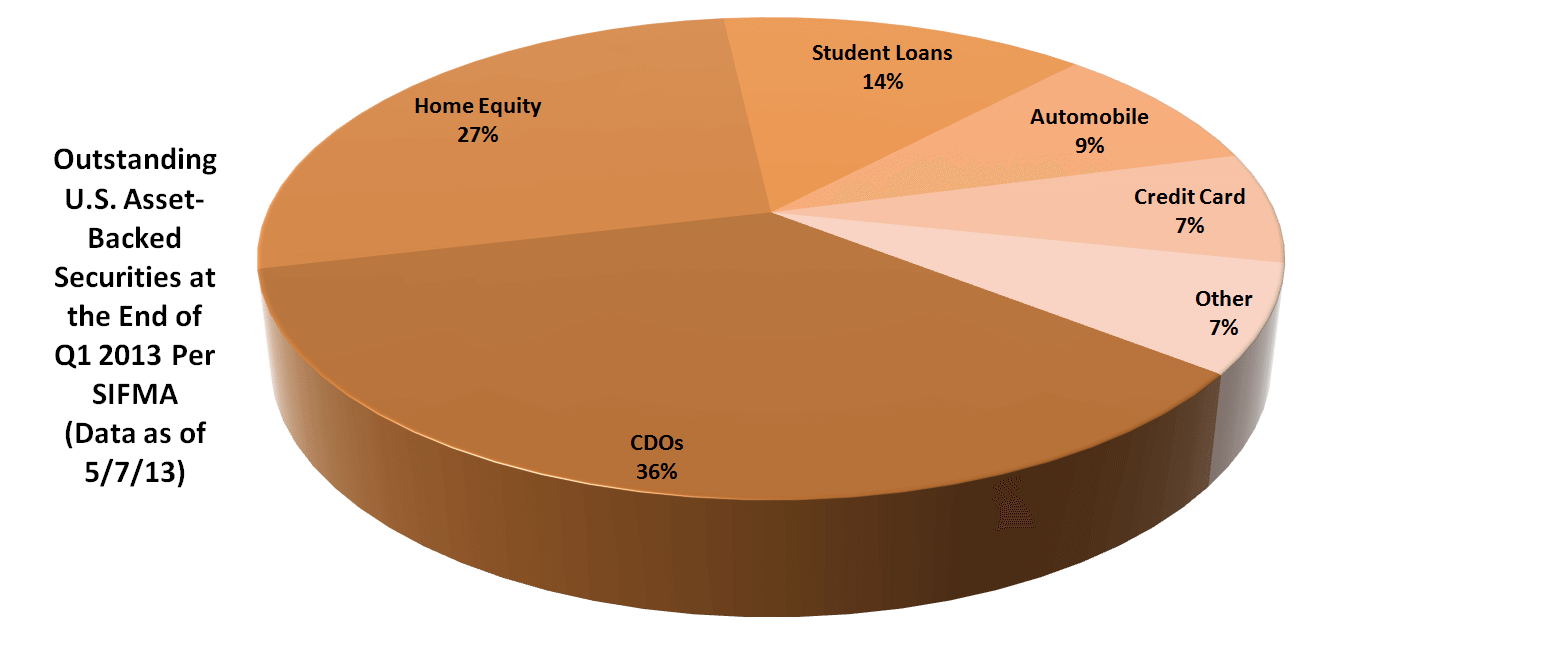
Asset-Backed
As mentioned above, the asset-backed market shrunk 49% on a GDP-adjusted basis from the end of 2007 thru 2012. All major asset-backed debt categories shrunk strongly in market size, except Student Loans, which grew slightly in non-GDP-adjusted terms. Also, it should be noted that the Automobile and Other category market sizes have been recovering recently from their strong fall. CDOs are collateralized debt obligations.
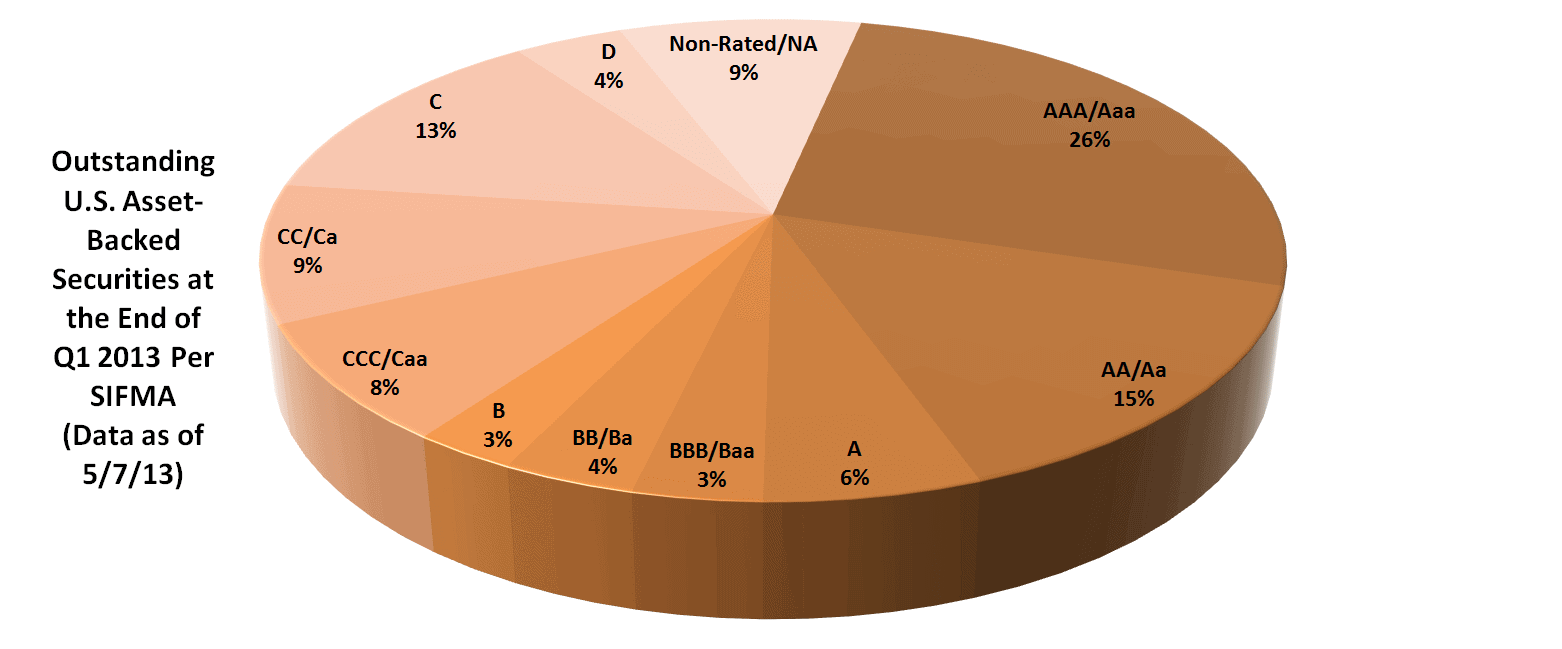
Only half of all asset-backed debt has a known investment-grade rating. In the Home Equity space, only 8% of the debt has a known investment-grade rating, whereas in the Credit Card, Automobile, and Student Loans spaces the known-investment-grade-rating figures are 98%, 94%, and 91% respectively. The known-investment-grade-rating figures for the Other and CDOs spaces are 60% and 43% respectively.
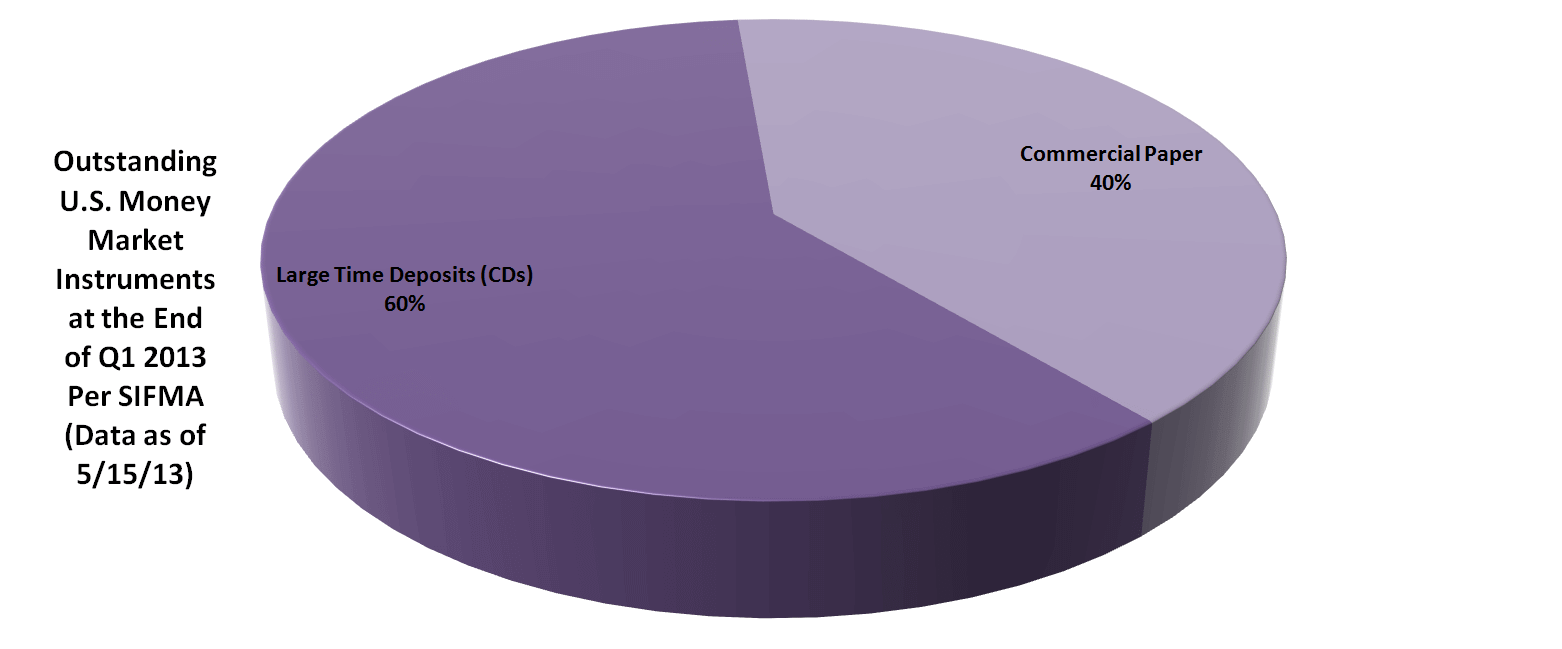
Money Market
As mentioned above, the money market (including CDs) market shrunk 47% on a GDP-adjusted basis from the end of 2007 thru 2012. Large decreases in market size occurred in both the Large Time Deposits (CDs) and Commercial Paper categories. The decrease was greater in the Commercial Paper category.
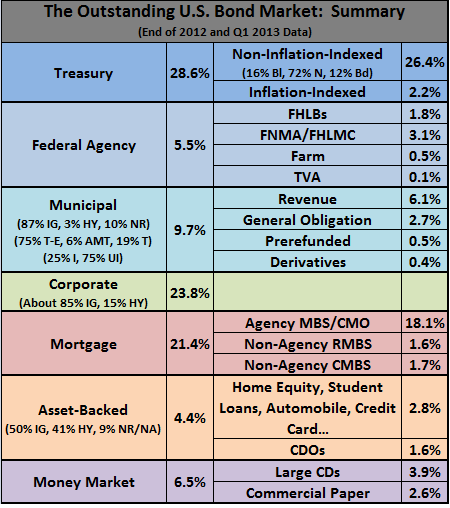
Summary
Below is a condensed version of much of the above information. It is, from an amount-outstanding-by-debt-type perspective, the U.S. bond market in a nutshell.
For more investment ideas and resources, see our featured stockbrokers and mobile trading apps. Alternatively, to buy shares in the UK, see our featured Stock brokers or Spreadbetting companies for more details.
Trusted & Regulated Stock & CFD Brokers

What we like
- 0% Fees on Stocks
- 5000+ Stocks, ETFs and other Markets
- Accepts Paypal Deposits
Min Deposit
$200
Charge per Trade
Zero Commission on real stocks
64 traders signed up today
Visit Now67% of retail investor accounts lose money when trading CFDs with this provider. You should consider whether you can afford to take the high risk of losing your money.
Available Assets
- Total Number of Stocks & Shares5000+
- US Stocks
- German Stocks
- UK Stocks
- European
- ETF Stocks
- IPO
- Funds
- Bonds
- Options
- Futures
- CFDs
- Crypto
Charge per Trade
- FTSE 100 Zero Commission
- NASDAQ Zero Commission
- DAX Zero Commission
- Facebook Zero Commission
- Alphabet Zero Commission
- Tesla Zero Commission
- Apple Zero Commission
- Microsoft Zero Commission
Deposit Method
- Wire Transfer
- Credit Cards
- Bank Account
- Paypall
- Skrill
- Neteller
What we like
- Sign up today and get $5 free
- Fractals Available
- Paypal Available
Min Deposit
$0
Charge per Trade
$1 to $9 PCM
Visit Now
Investing in financial markets carries risk, you have the potential to lose your total investment.
Available Assets
- Total Number of Shares999
- US Stocks
- German Stocks
- UK Stocks
- European Stocks
- EFTs
- IPOs
- Funds
- Bonds
- Options
- Futures
- CFDs
- Crypto
Charge per Trade
- FTSE 100 $1 - $9 per month
- NASDAQ $1 - $9 per month
- DAX $1 - $9 per month
- Facebook $1 - $9 per month
- Alphabet $1 - $9 per month
- Telsa $1 - $9 per month
- Apple $1 - $9 per month
- Microsoft $1 - $9 per month
Deposit Method
- Wire Transfer
- Credit Cards
- Bank Account